 Datadog
This feature is available to Algorithmia Enterprise users only.
In this tutorial, learn how you can monitor your model performance metrics with Datadog using the new Insights feature of Algorithmia Enterprise.
Algorithmia Insights is a new feature of Algorithmia Enterprise that provides a metrics pipeline that can be used to instrument, measure, and monitor your machine learning models. Monitoring your model performance metrics can help with your organization’s overall AI/ML governance efforts, and use cases include detecting model drift, data drift, and model bias.
Datadog is a cloud-based monitoring service that aggregates metrics and logs across different services. You can use Insights to send real-time model performance metrics from Algorithmia to Datadog as time-series data that can be included in dashboards, monitors, and alerts.
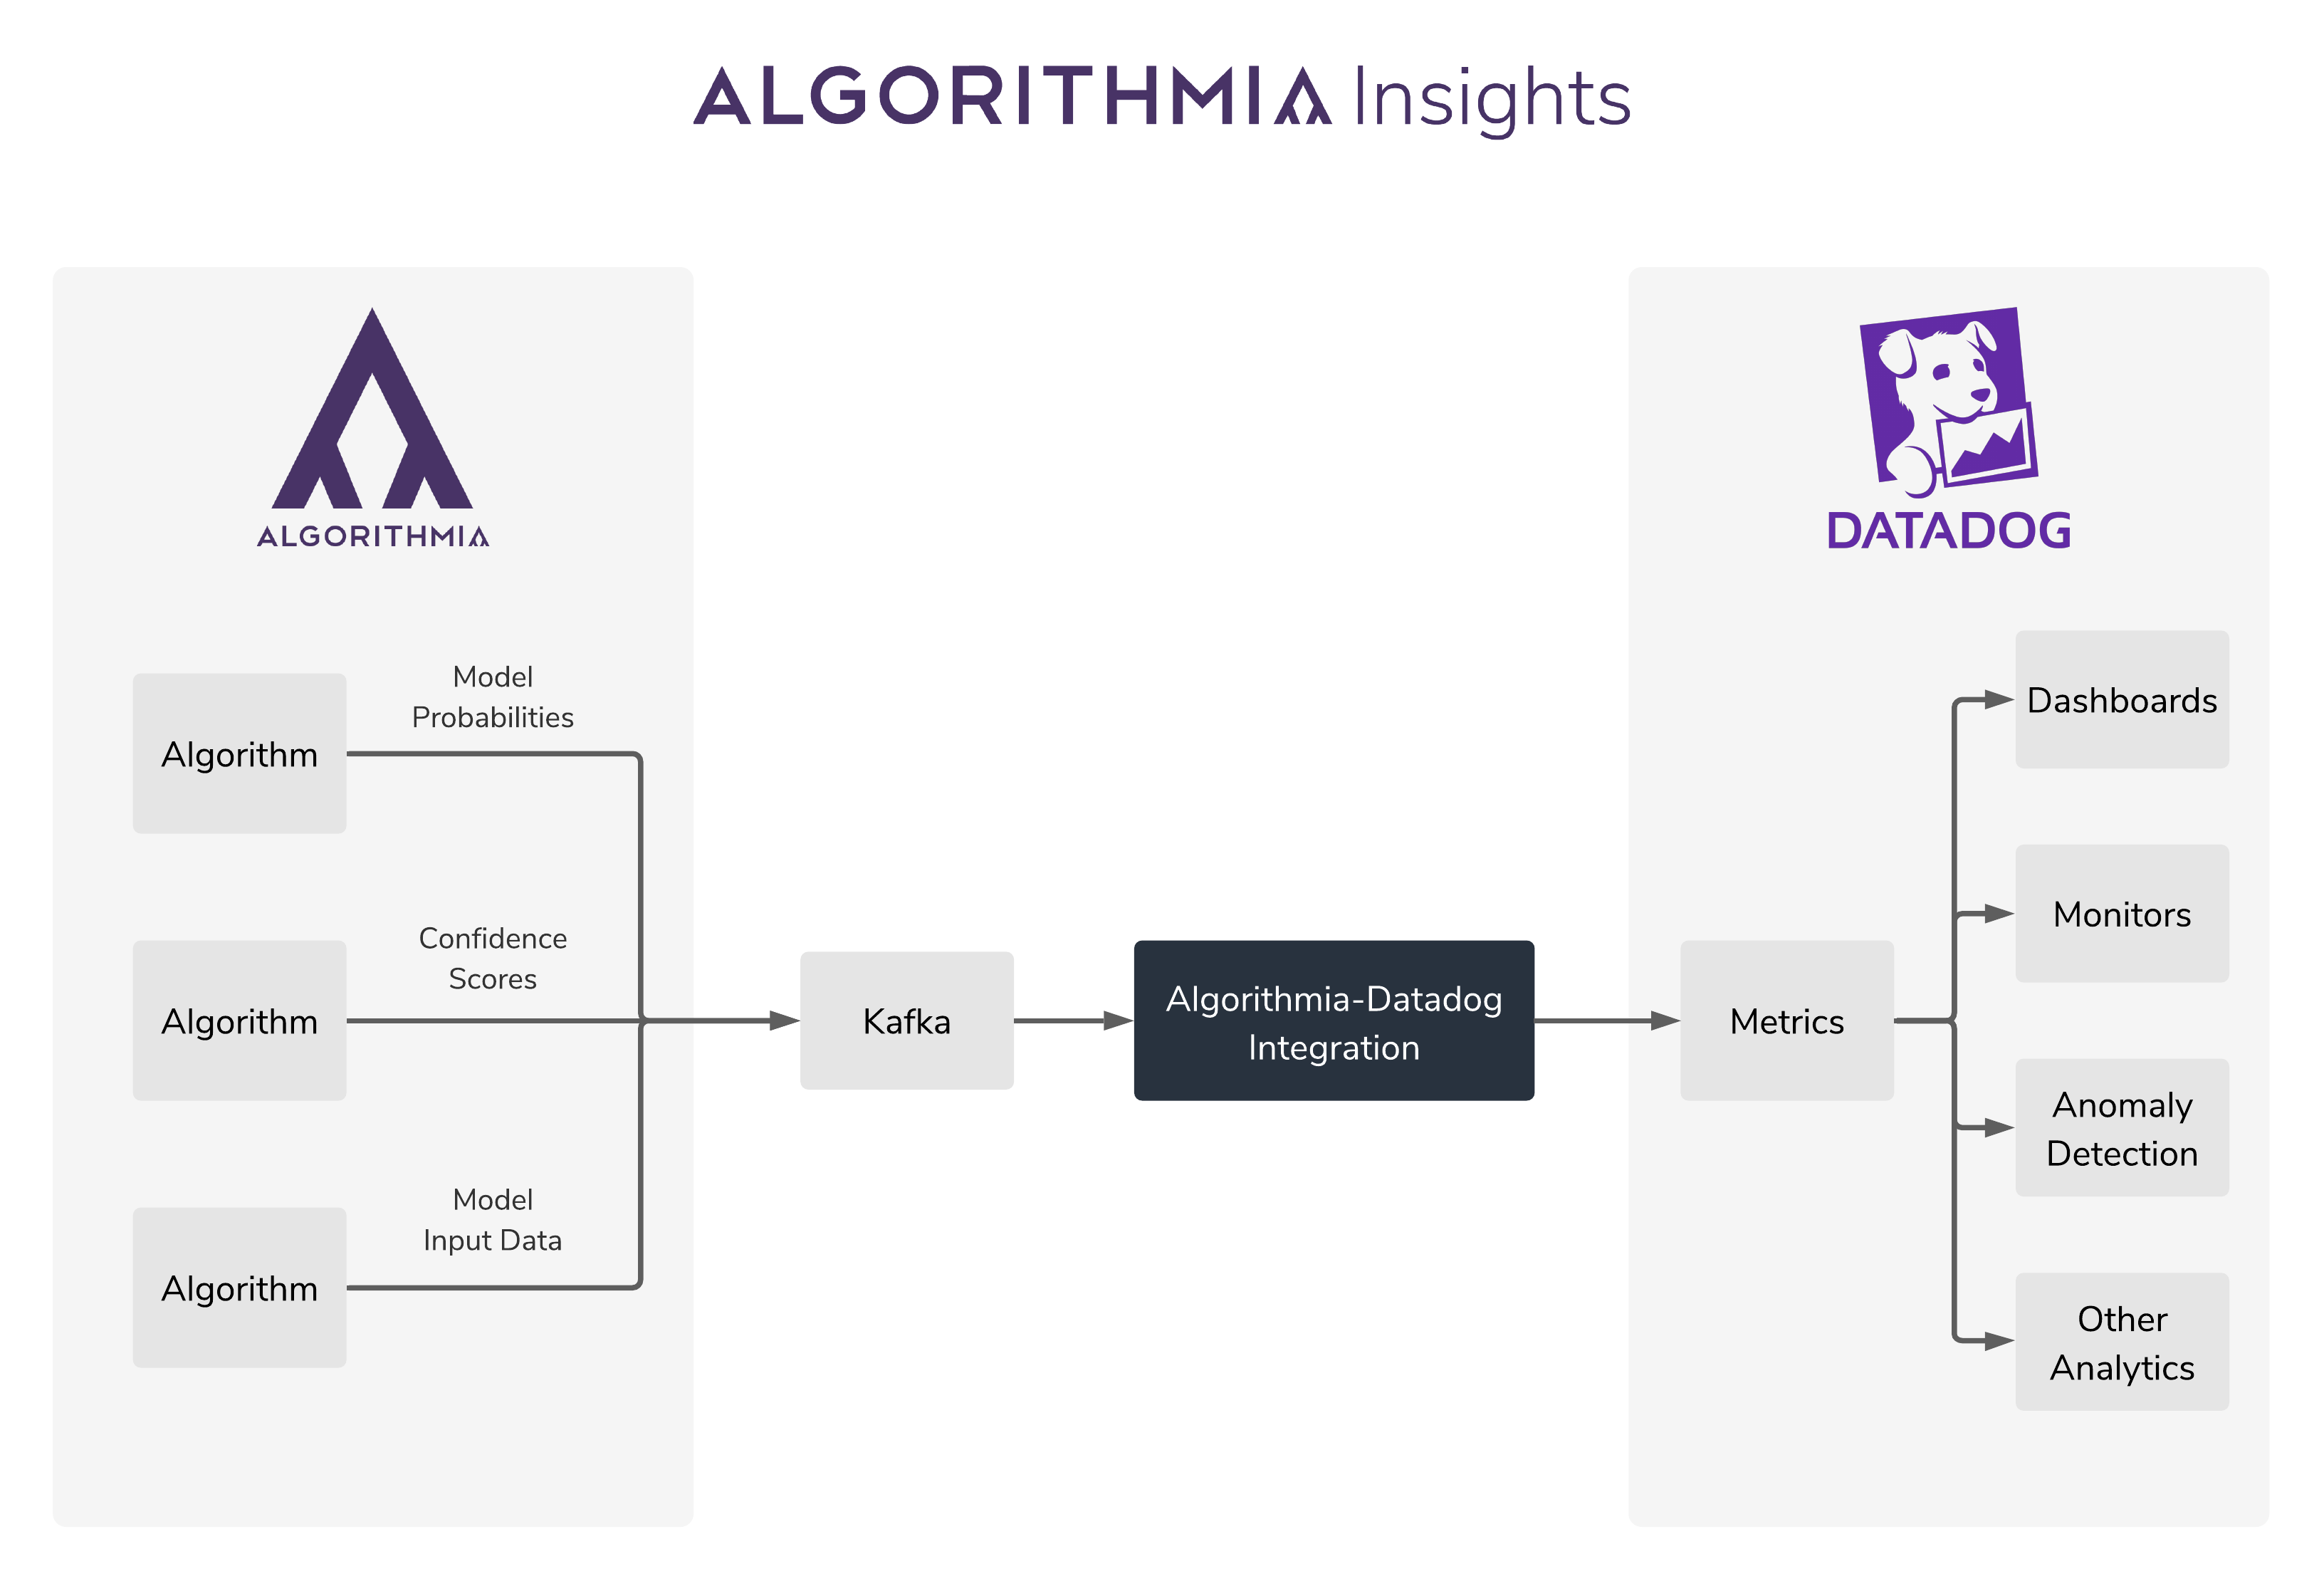
The Algorithmia-Datadog integration described in this post allows you to stream operational and inference metrics from your models in Algorithmia to Datadog, where you can create dashboards, monitors, and alerts to analyze model performance metrics in production systems across your entire model catalog.
How the Algorithmia-Datadog integration works
When algorithms that have Insights enabled are run, Algorithmia emits a metrics payload to a configured Kafka broker and topic. The Algorithmia-Datadog integration then transforms and forwards Insights data from Kafka to the Datadog metrics API endpoint. All of the data from Algorithmia Insights will show up in Datadog as metrics with the prefix algorithmia. This makes it easy to include model performance data from Algorithmia Insights in dashboards or monitors.
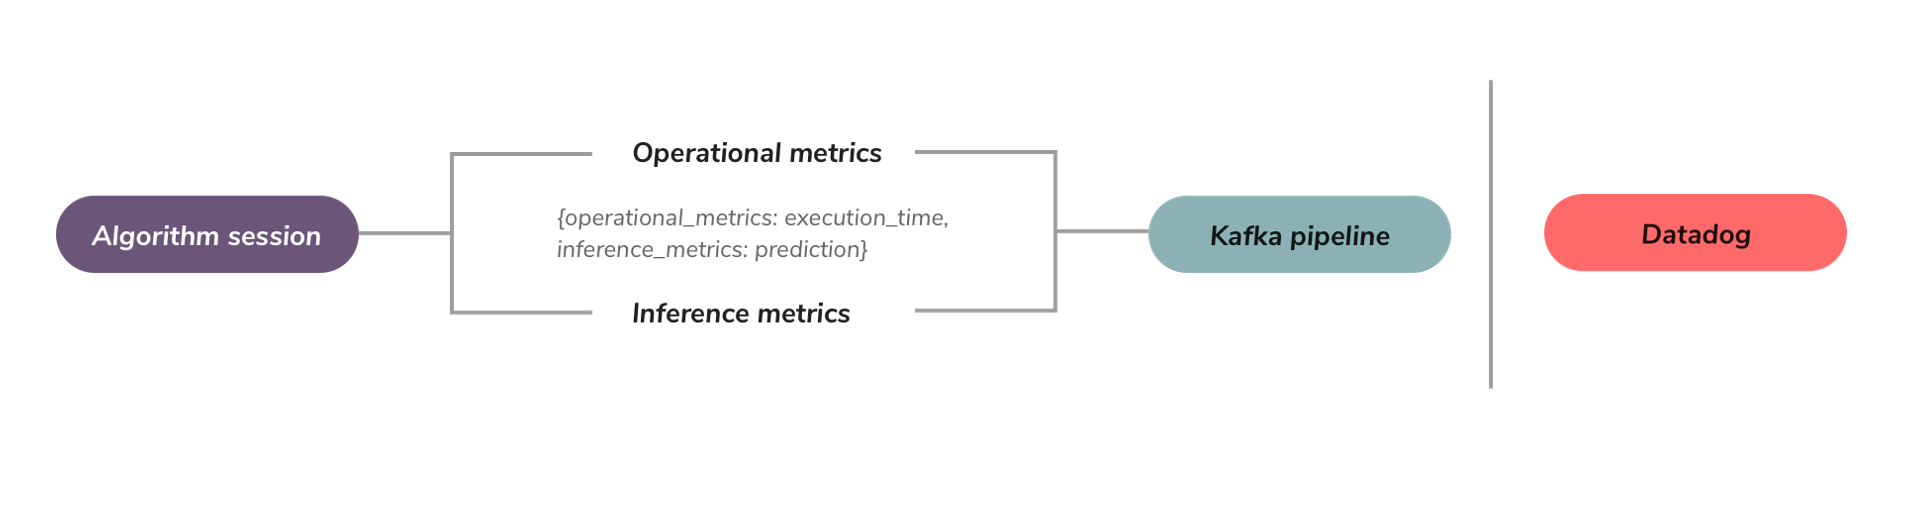
The metrics payload from Algorithmia Insights contains both operational and inference metrics. Operational metrics include the algorithm name, version, owner, duration, session ID, and request ID. Inference metrics include user-defined metrics that are specified by data scientists depending on the particular algorithm and use case.
When this integration is used, all of the operational metrics related to the algorithm name, version, owner, request ID, and session ID will be included with each data point as tags in Datadog. These tags can then be used to filter and group model performance metrics in dashboards and monitors.
The steps to install and configure this integration can be summarized as:
- Configure Algorithmia to send Insights to a Kafka broker and topic
- Install and run the Algorithmia-Datadog integration with your Kafka broker/topic and Datadog API key
- For any published algorithm on your cluster that has Insights enabled, once the algorithm’s API is called, those metrics will be pushed to DataDog.
- Verify that your metrics appear in Datadog as
algorithmia.<METRIC-NAME>
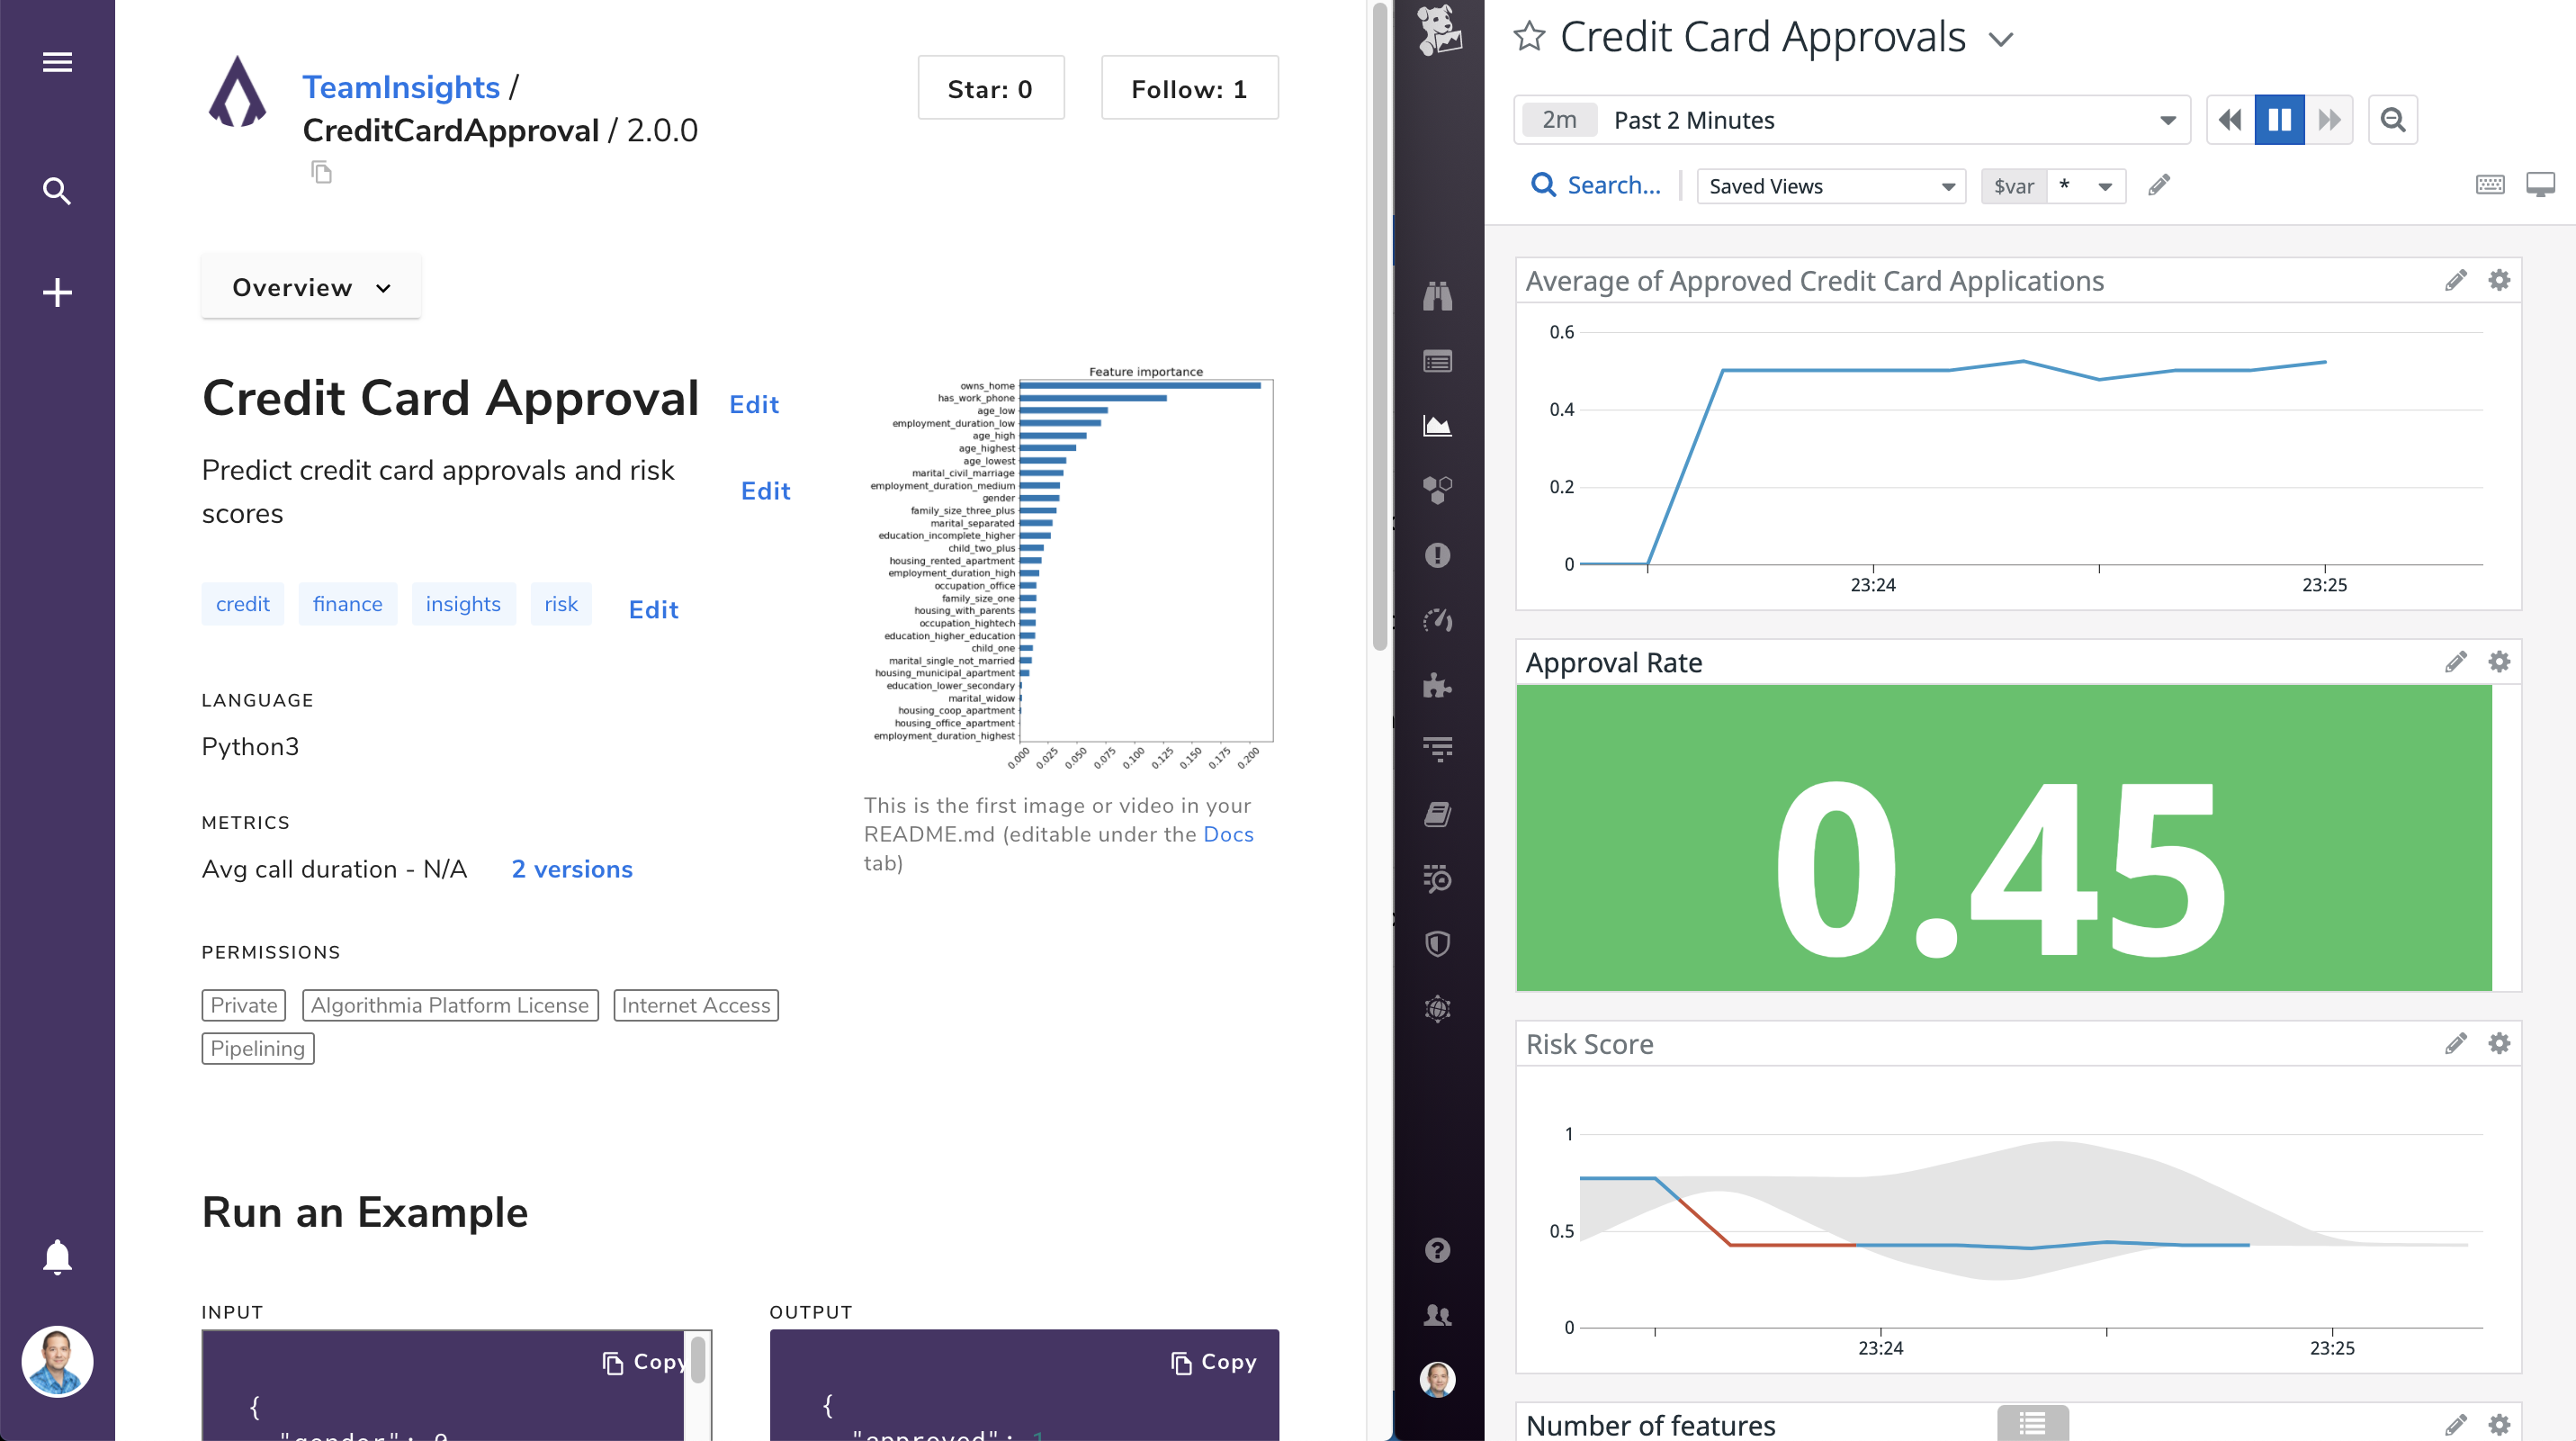
Once you’ve installed this integration in Datadog, you’ll have a default dashboard and monitor to help you get started with Insights and Datadog:
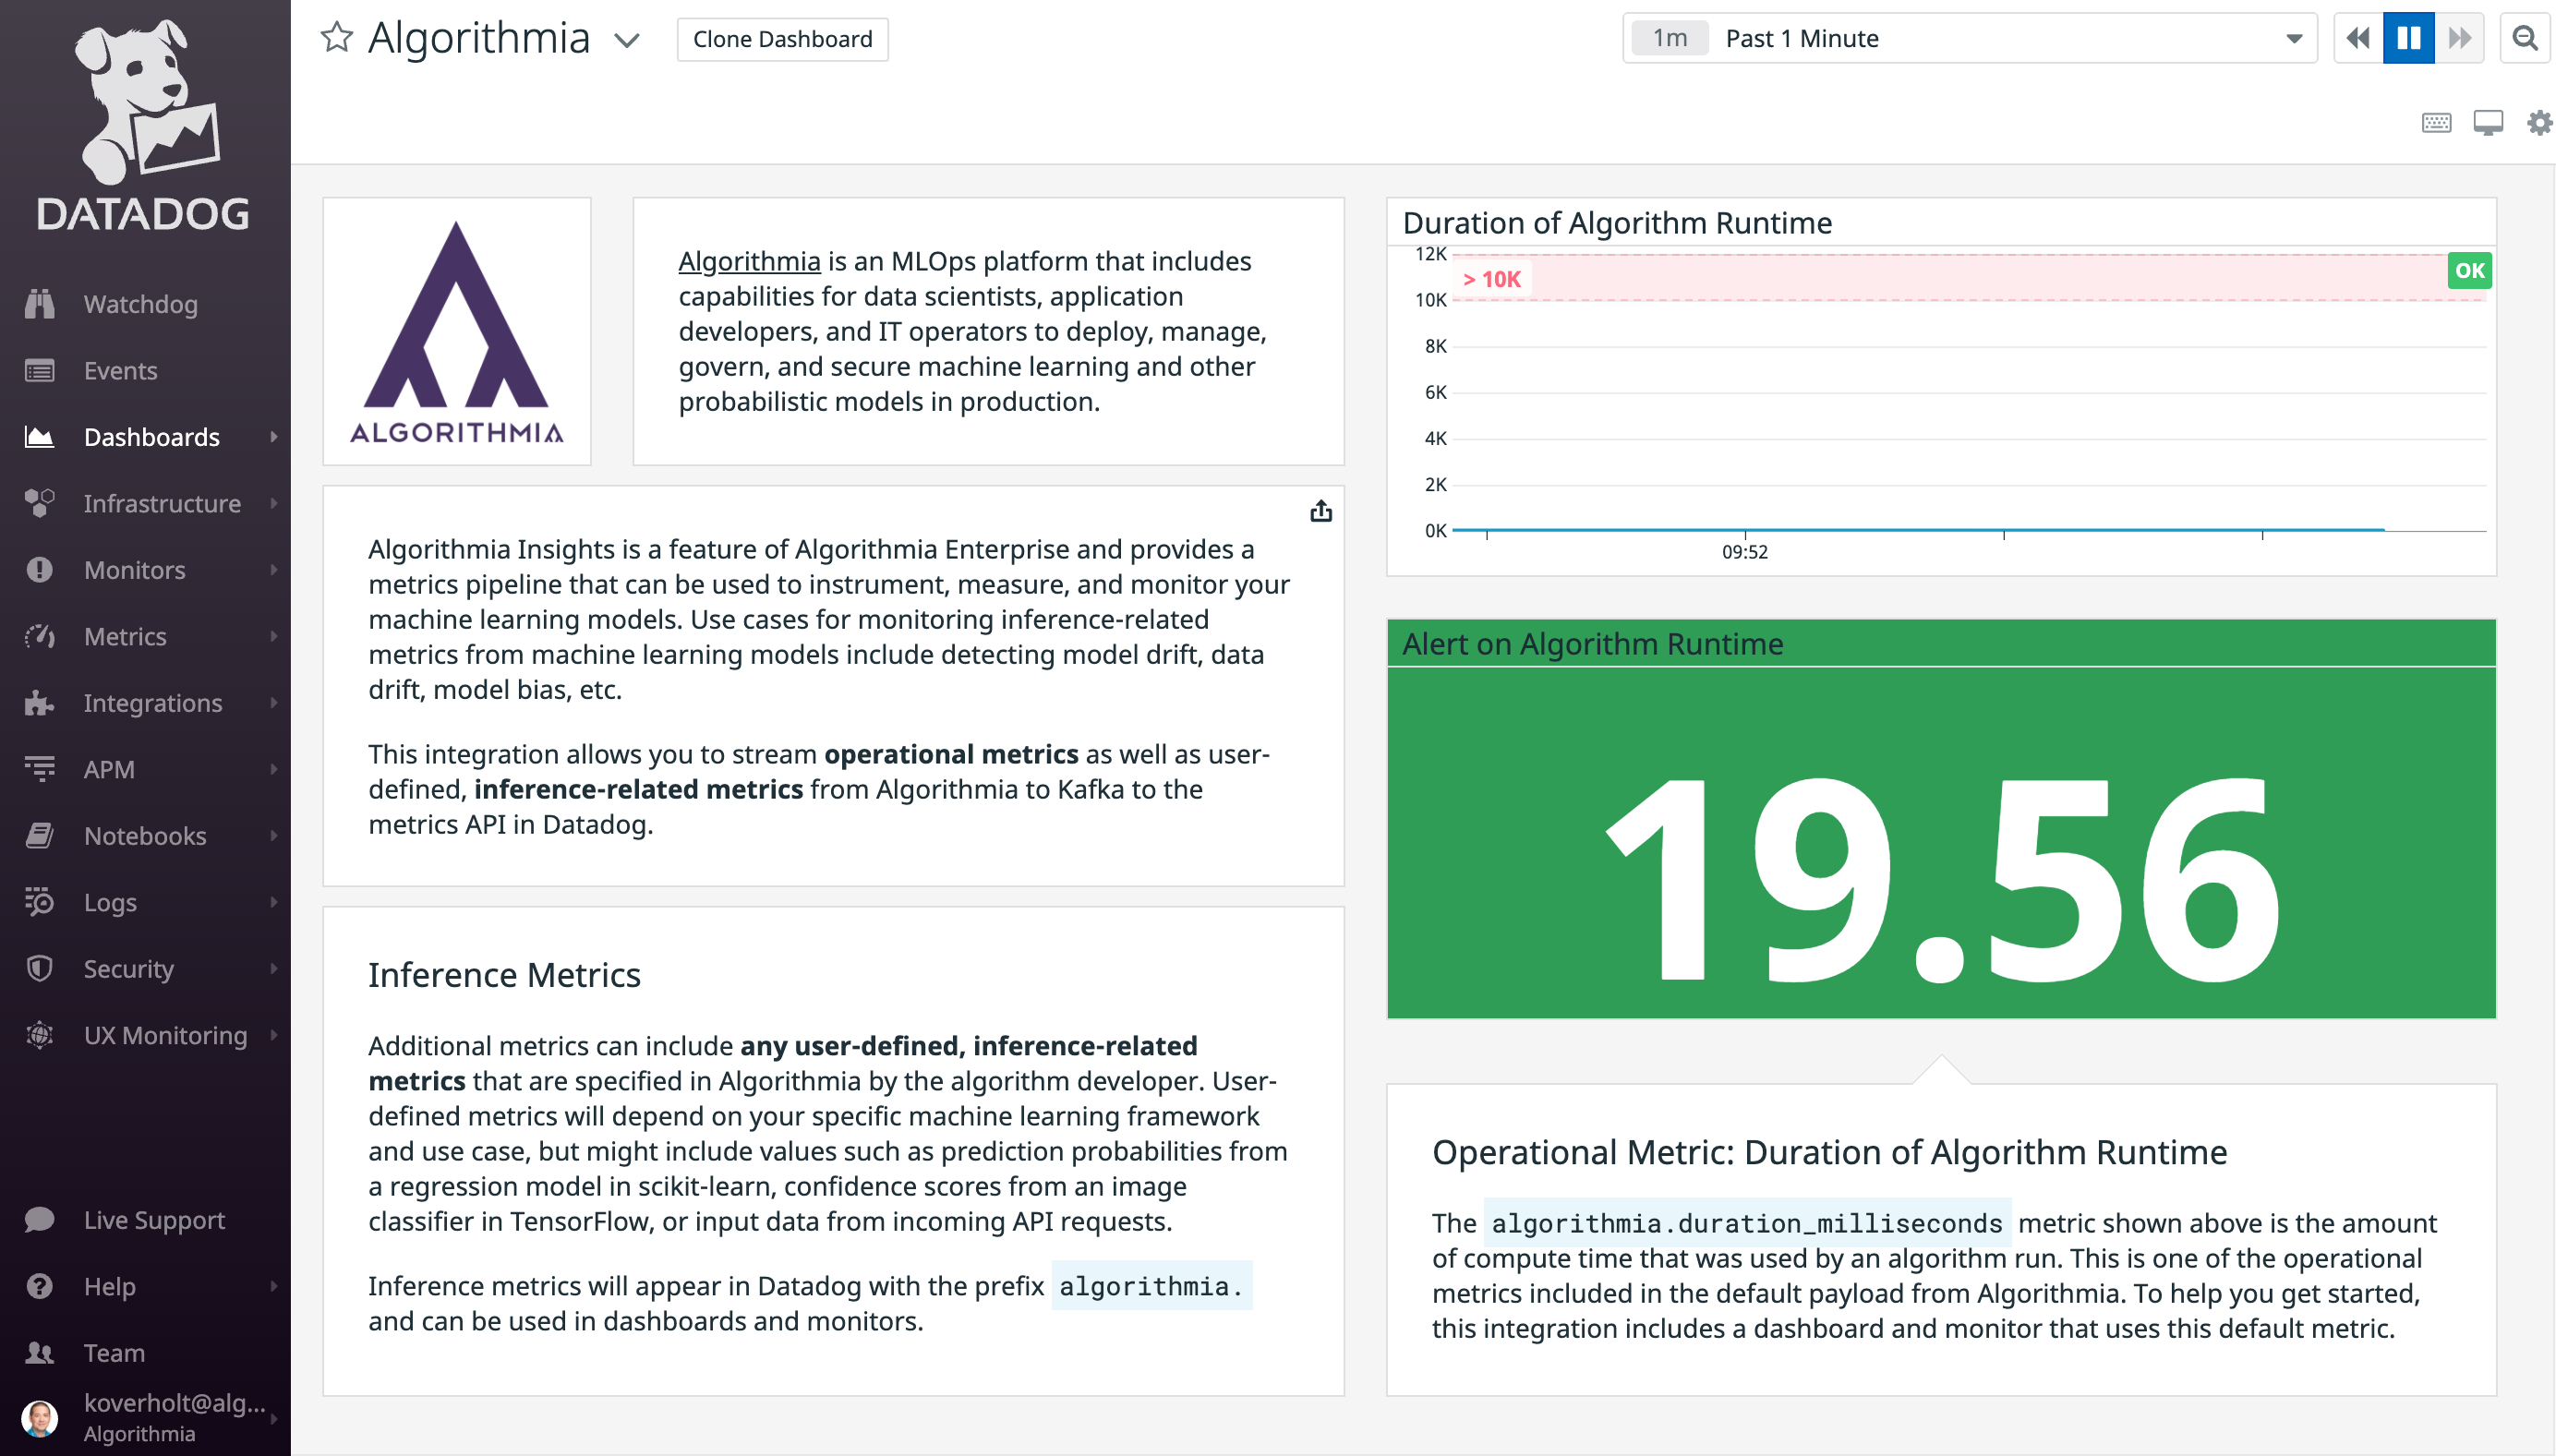
Refer to the integration page on Datadog and documentation in the Algorithmia integrations repository for more detailed information on installing and configuring this integration.
Example: Creating a dashboard with model performance metrics
Datadog provides dashboards for visually tracking, analyzing, and displaying key performance metrics, which enable you to monitor the performance of your models in real-time.
In this example, we’ll walk through the steps to create a new dashboard in Datadog and visualize metrics from Algorithmia Insights.
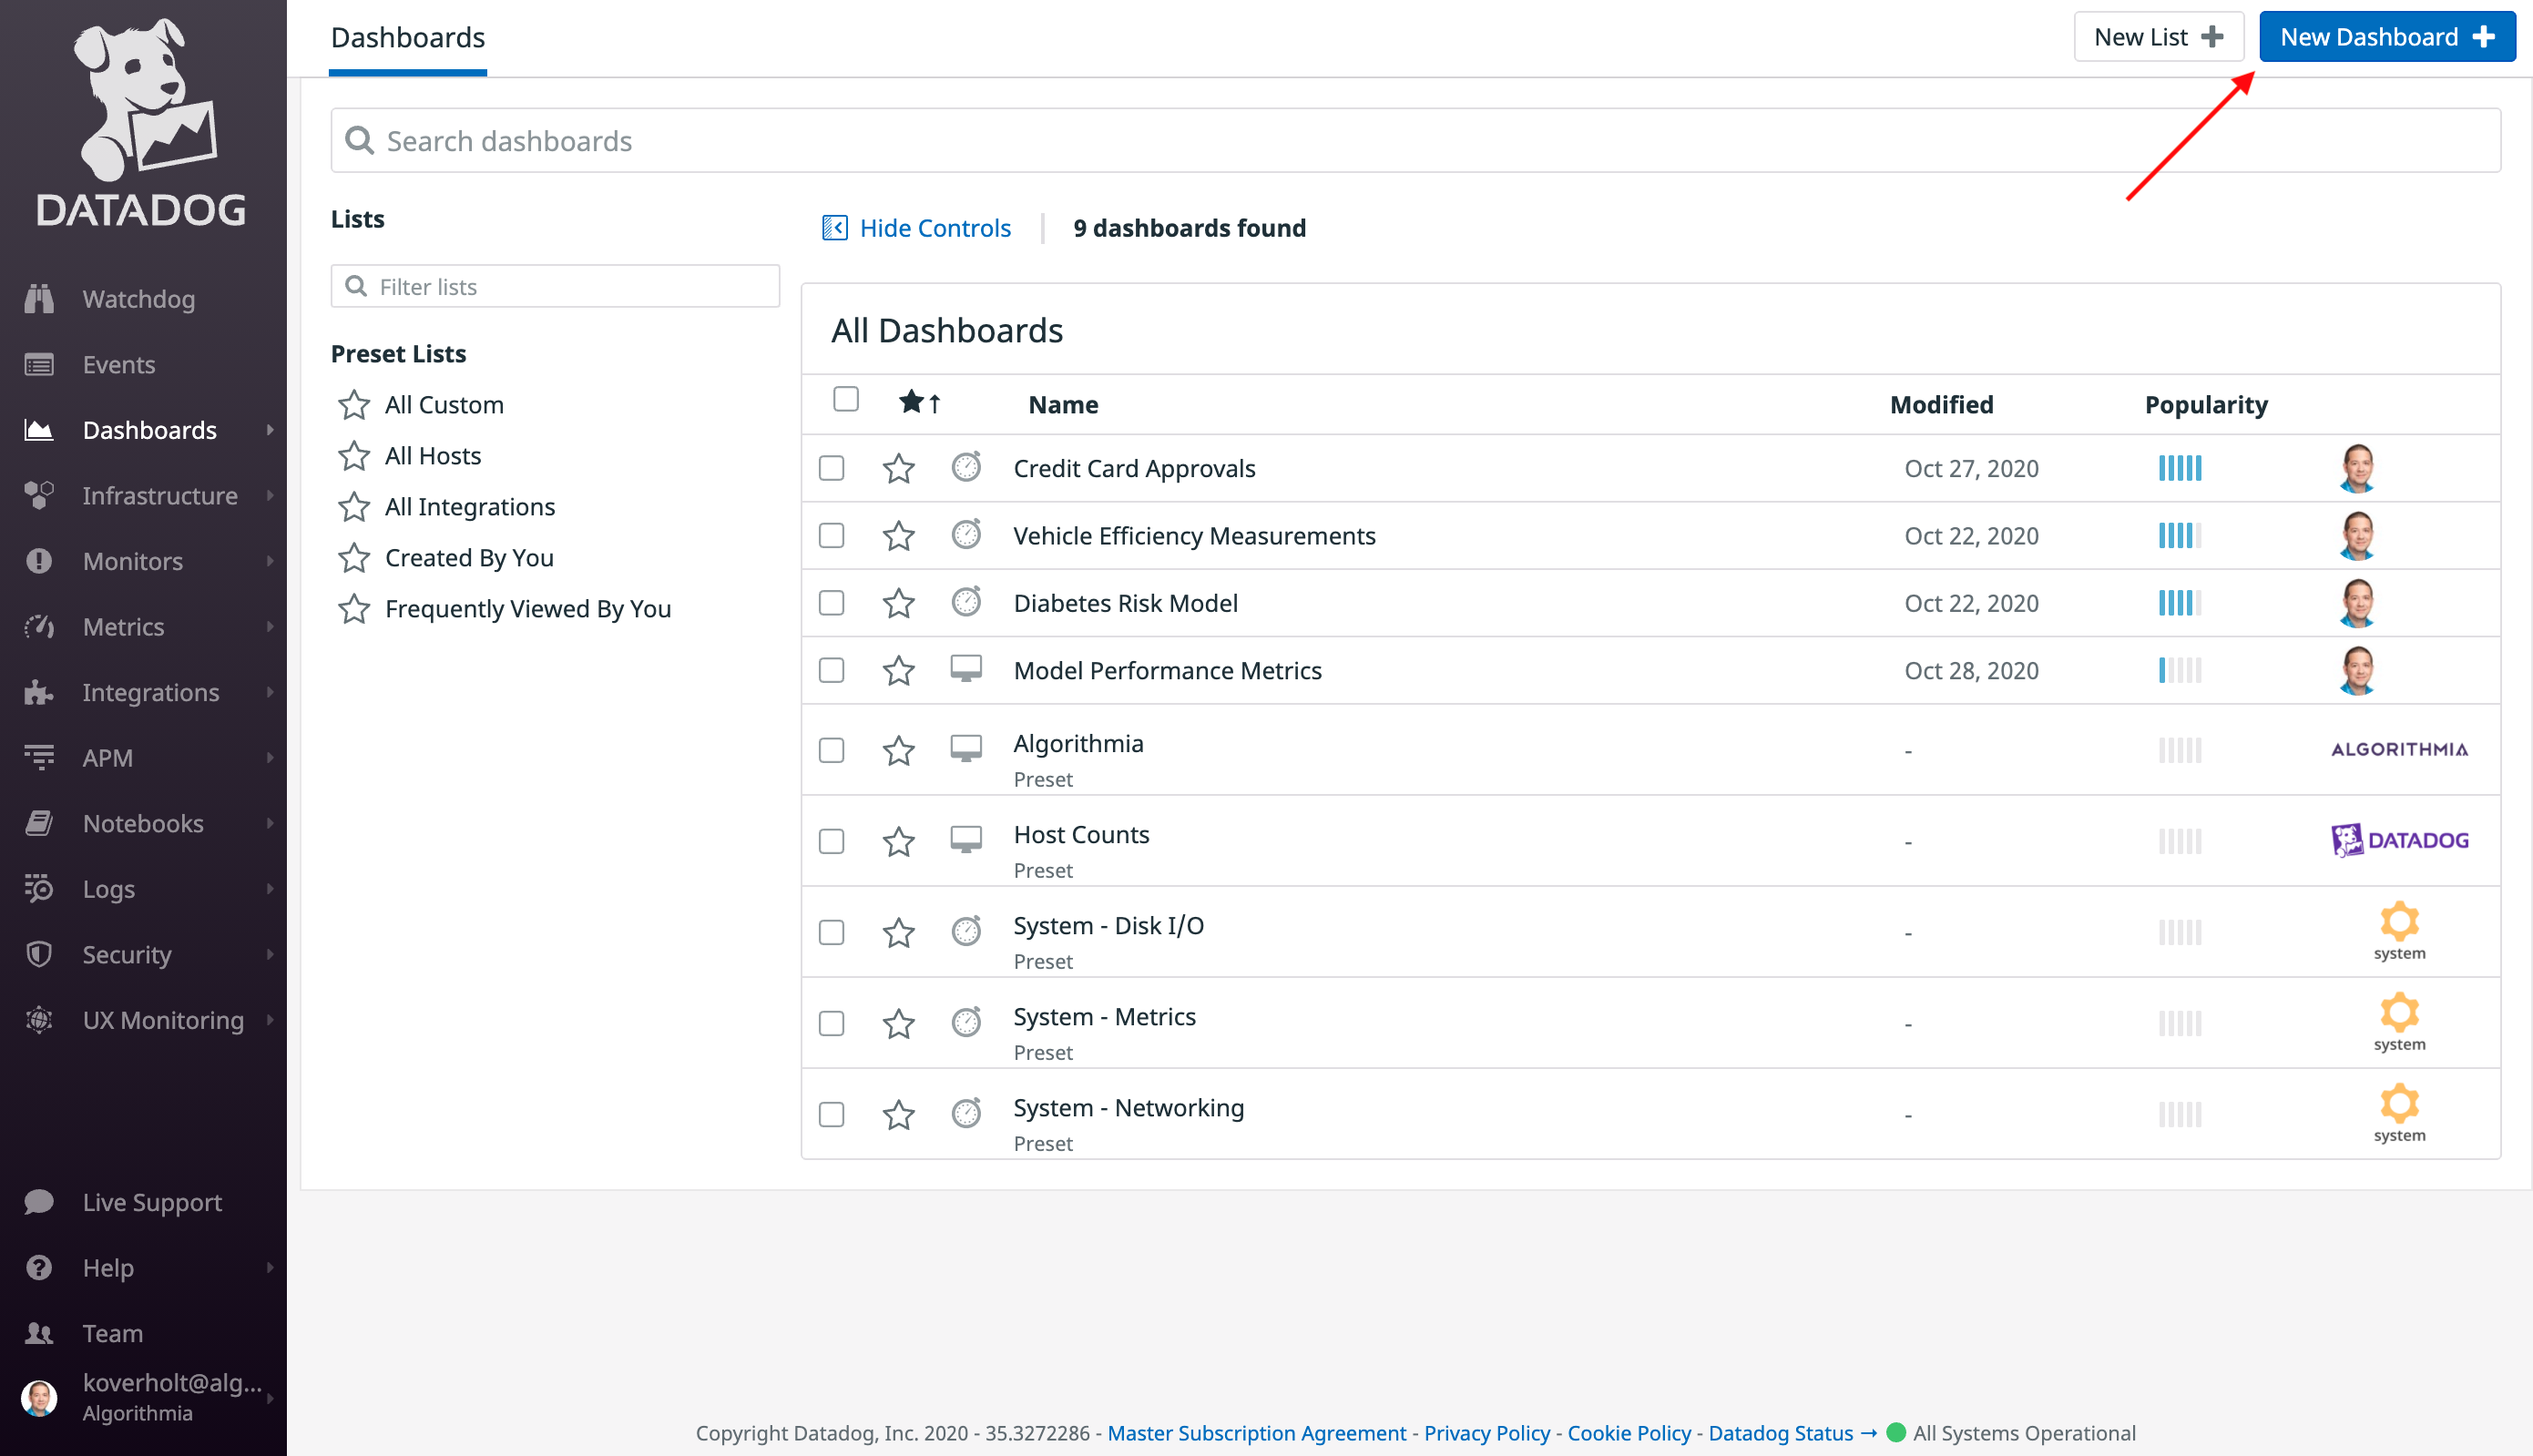
From the Dashboard page in Datadog, click on the New Dashboard button:
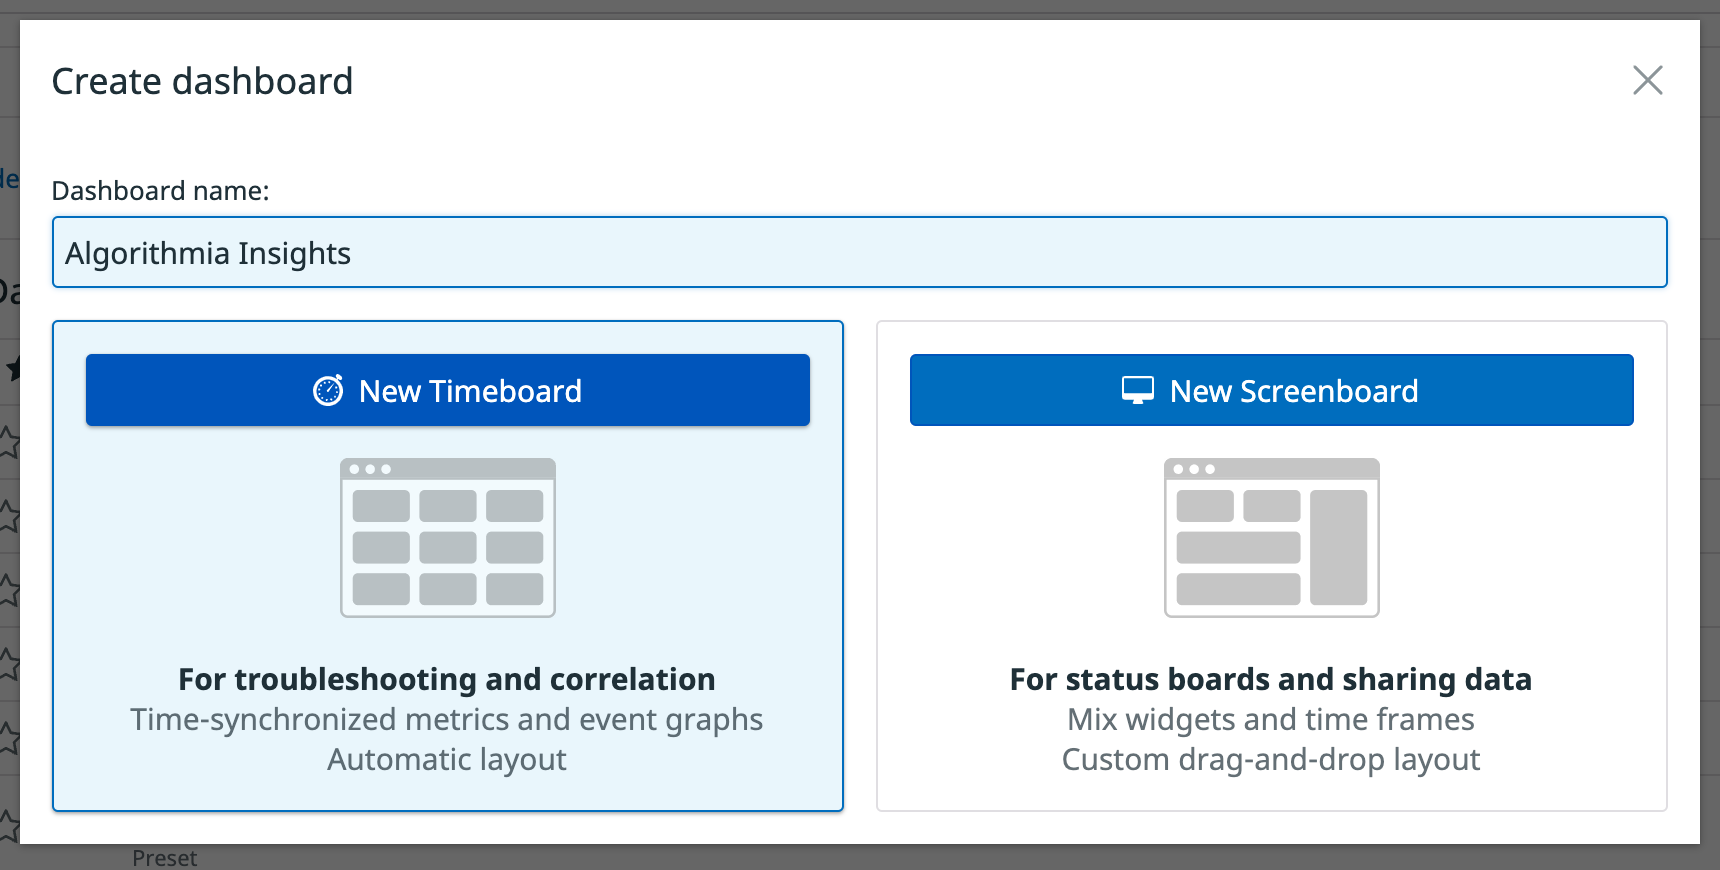
Specify a name for your new dashboard, then click on the New Timeboard button:
When viewing the new dashboard, click on the Edit Widgets button. Drag a new widget such as the Timeseries widget onto your dashboard:
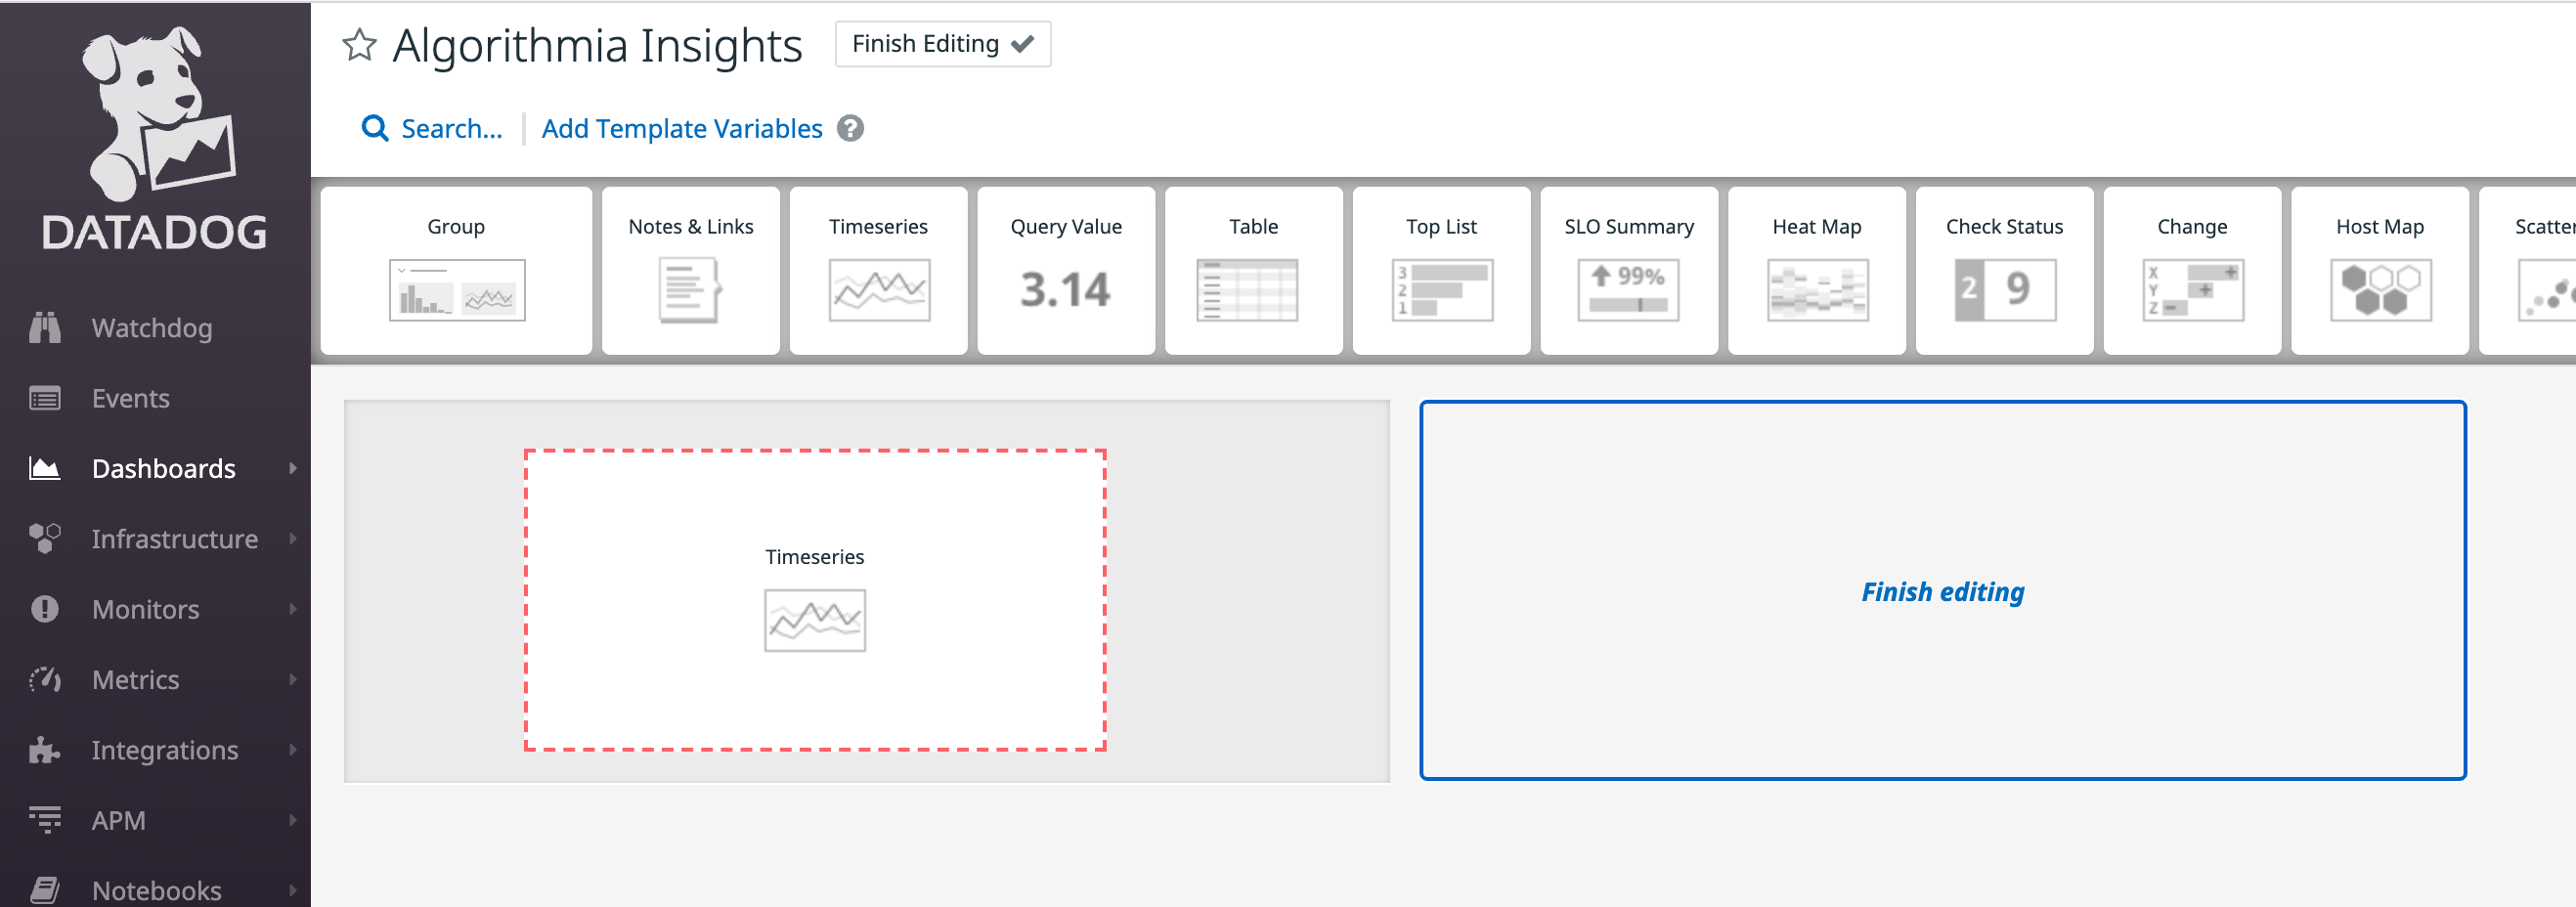
After dragging a widget on to the dashboard, a configuration screen will appear where you can select the type of visualization you want to use and which data to show on your graph.
In the Graph your data configuration section, select the metric that you want to display from the list of metrics that start with the prefix algorithmia . For example, we’ll choose the custom algorithmia.risk_score metric that we defined in a model (or you could choose the default operational metric named algorithmia.duration_milliseconds):
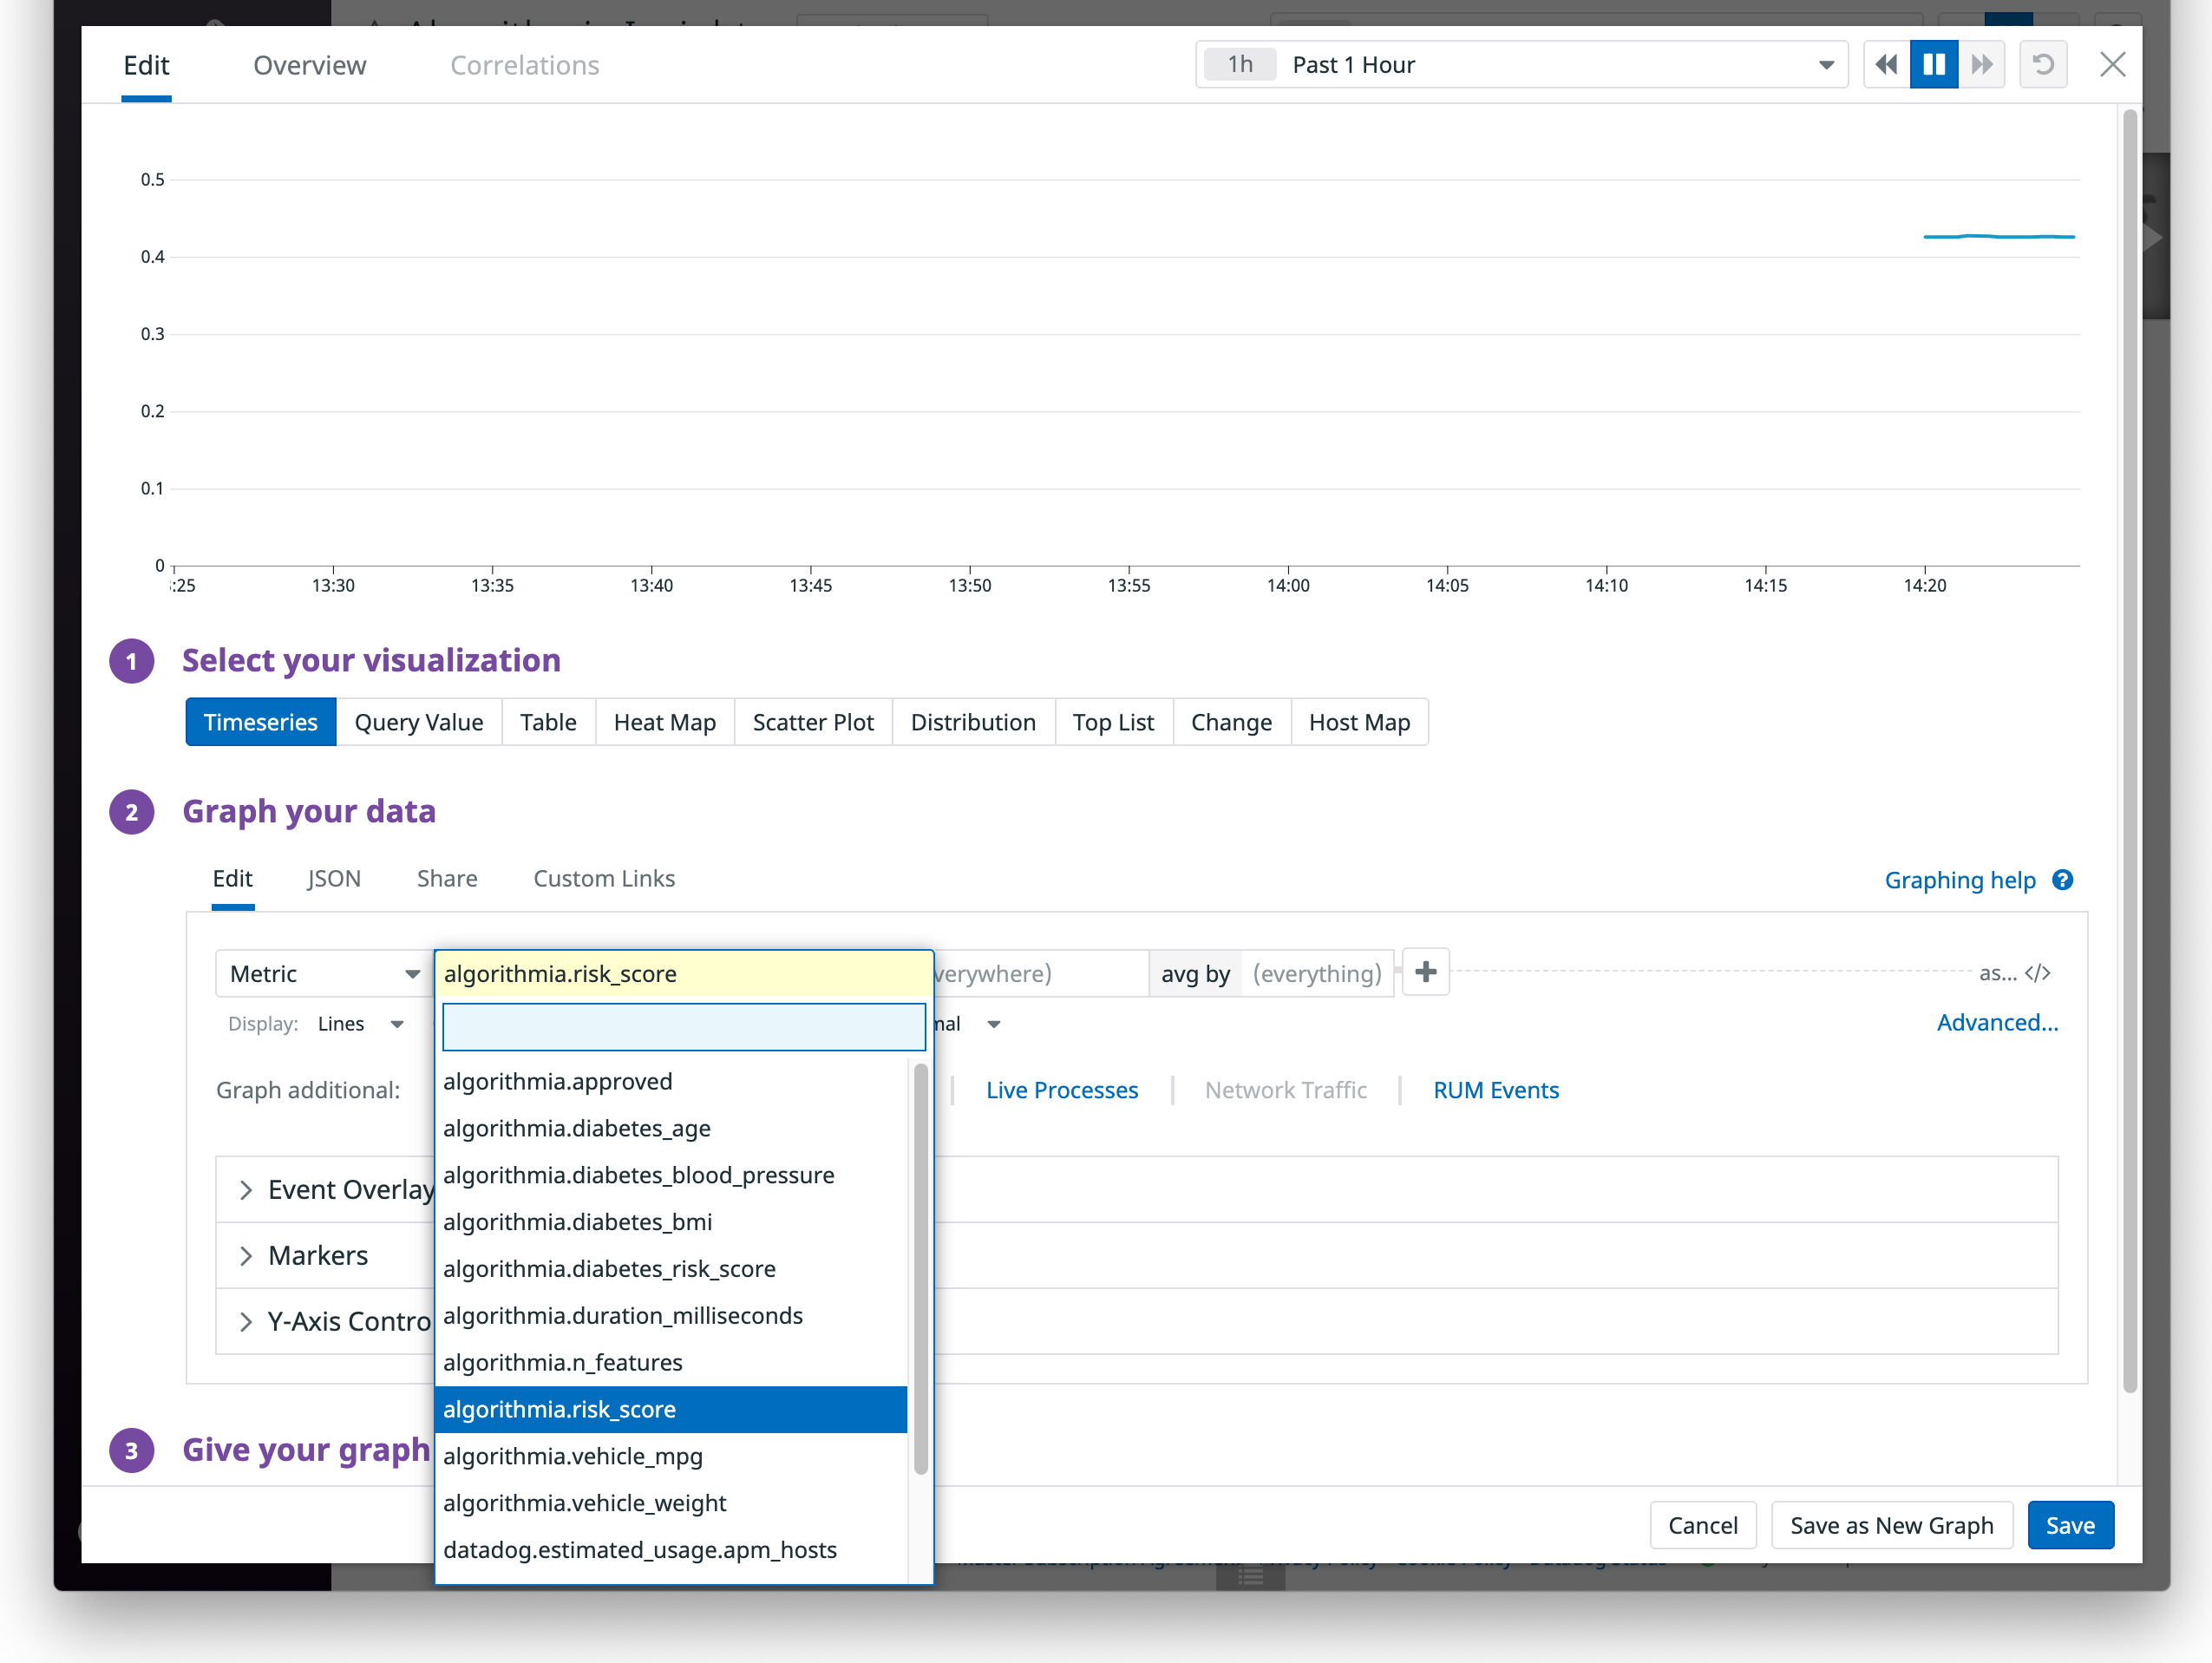
Click on the Save button, then the data from Insights should show up in your new widget. You might need to call your algorithm on your Algorithmia cluster to see data flowing into Datadog.
You can continue adding different widgets and customizing your dashboard to display different metrics from Insights:
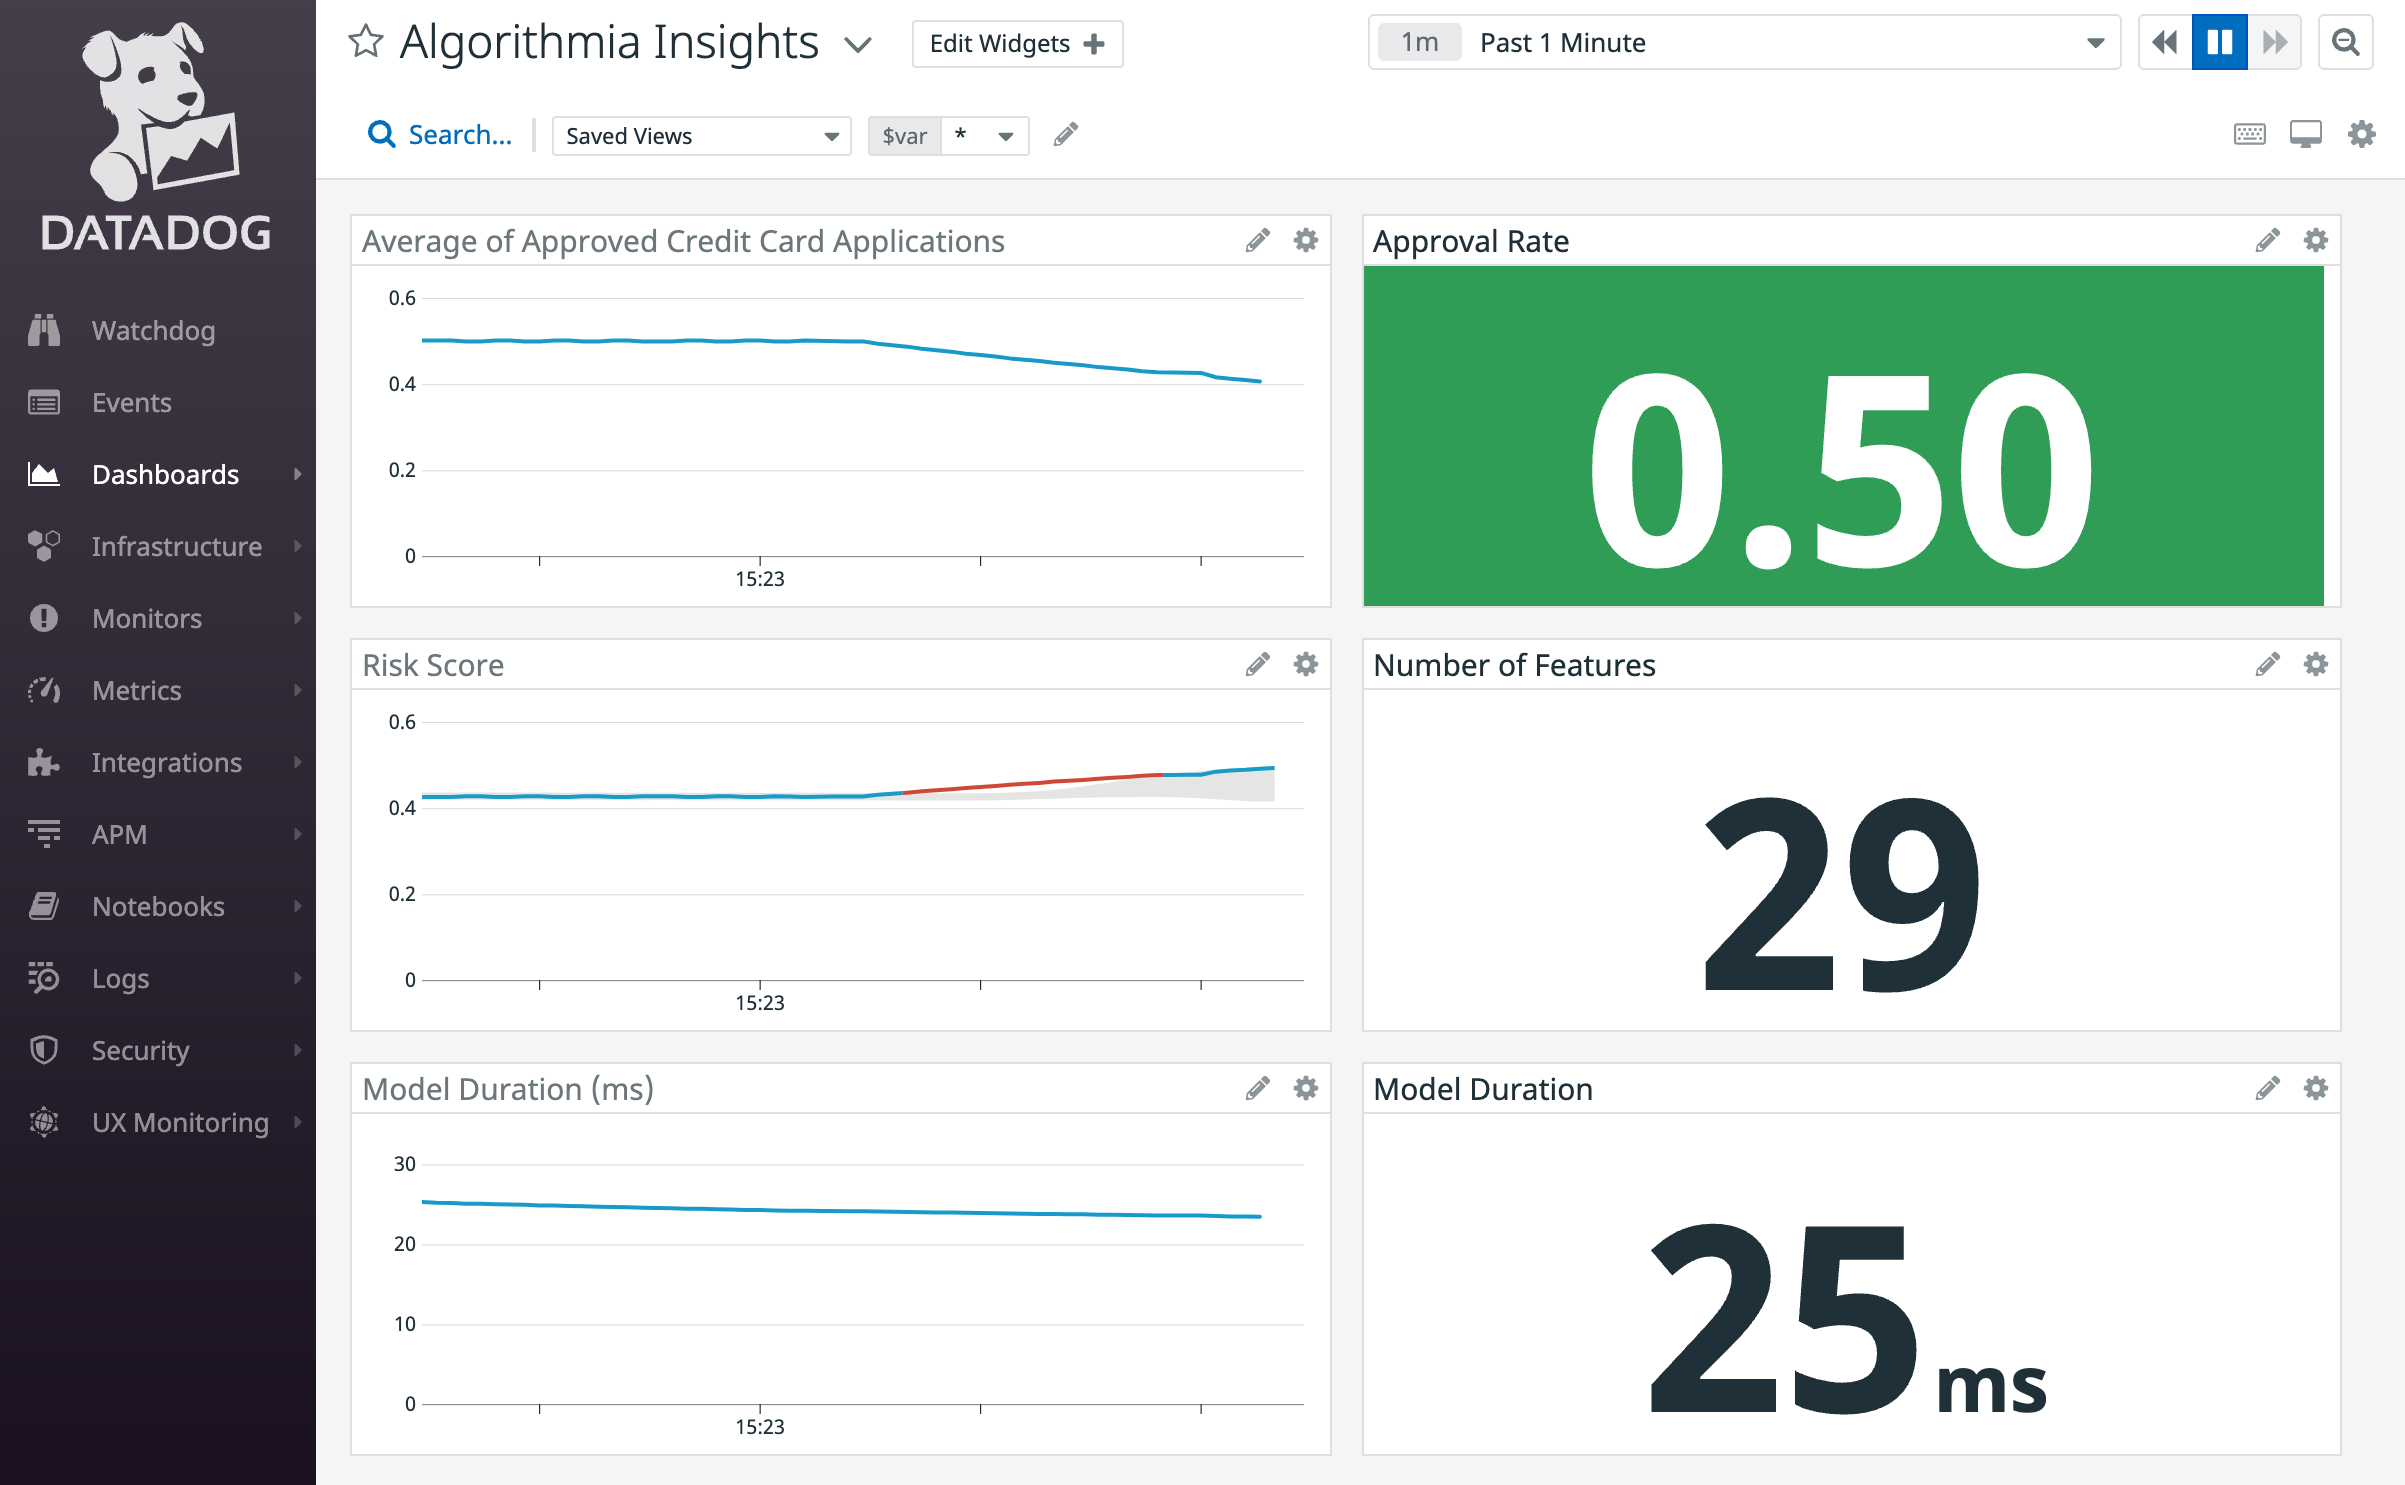
Now you’ll have all of the relevant model metrics from Insights displayed in one place with real-time updates as models are queried in Algorithmia.
Example: Creating a monitor for model performance metrics
Datadog provides monitors that provide the ability to know when critical changes are occurring by actively checking metrics and more.
In this example, we’ll walk through the steps to create a new monitor in Datadog to alert on metrics from Algorithmia Insights.
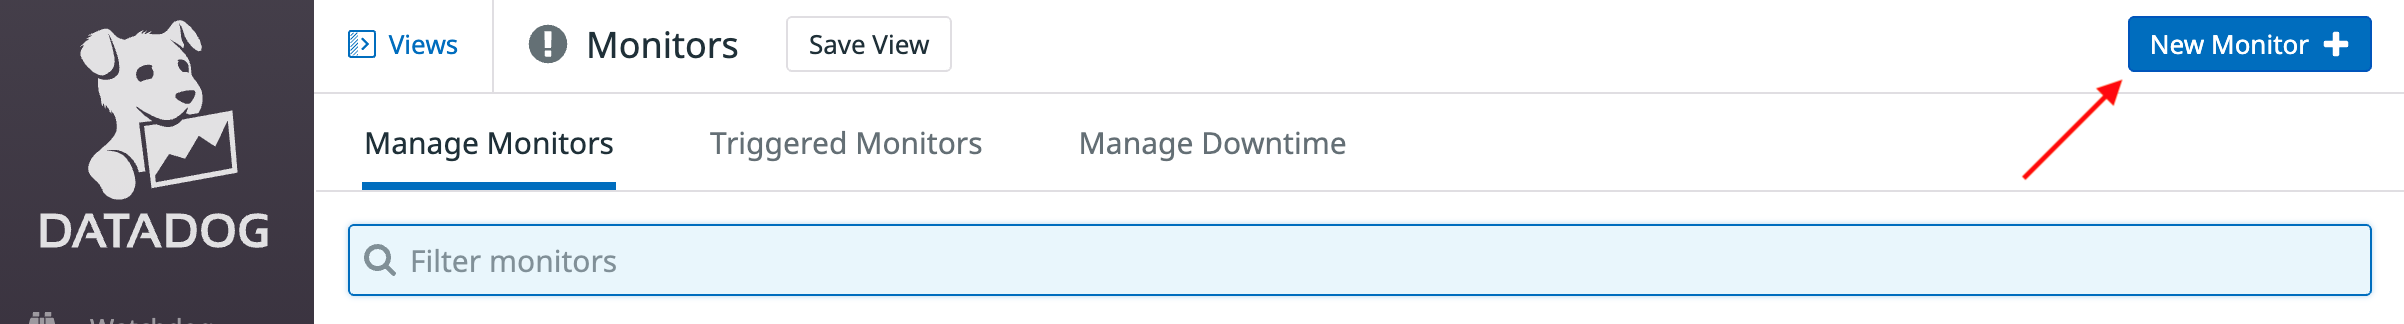
From the Monitors page in Datadog, click on the New Monitor button:
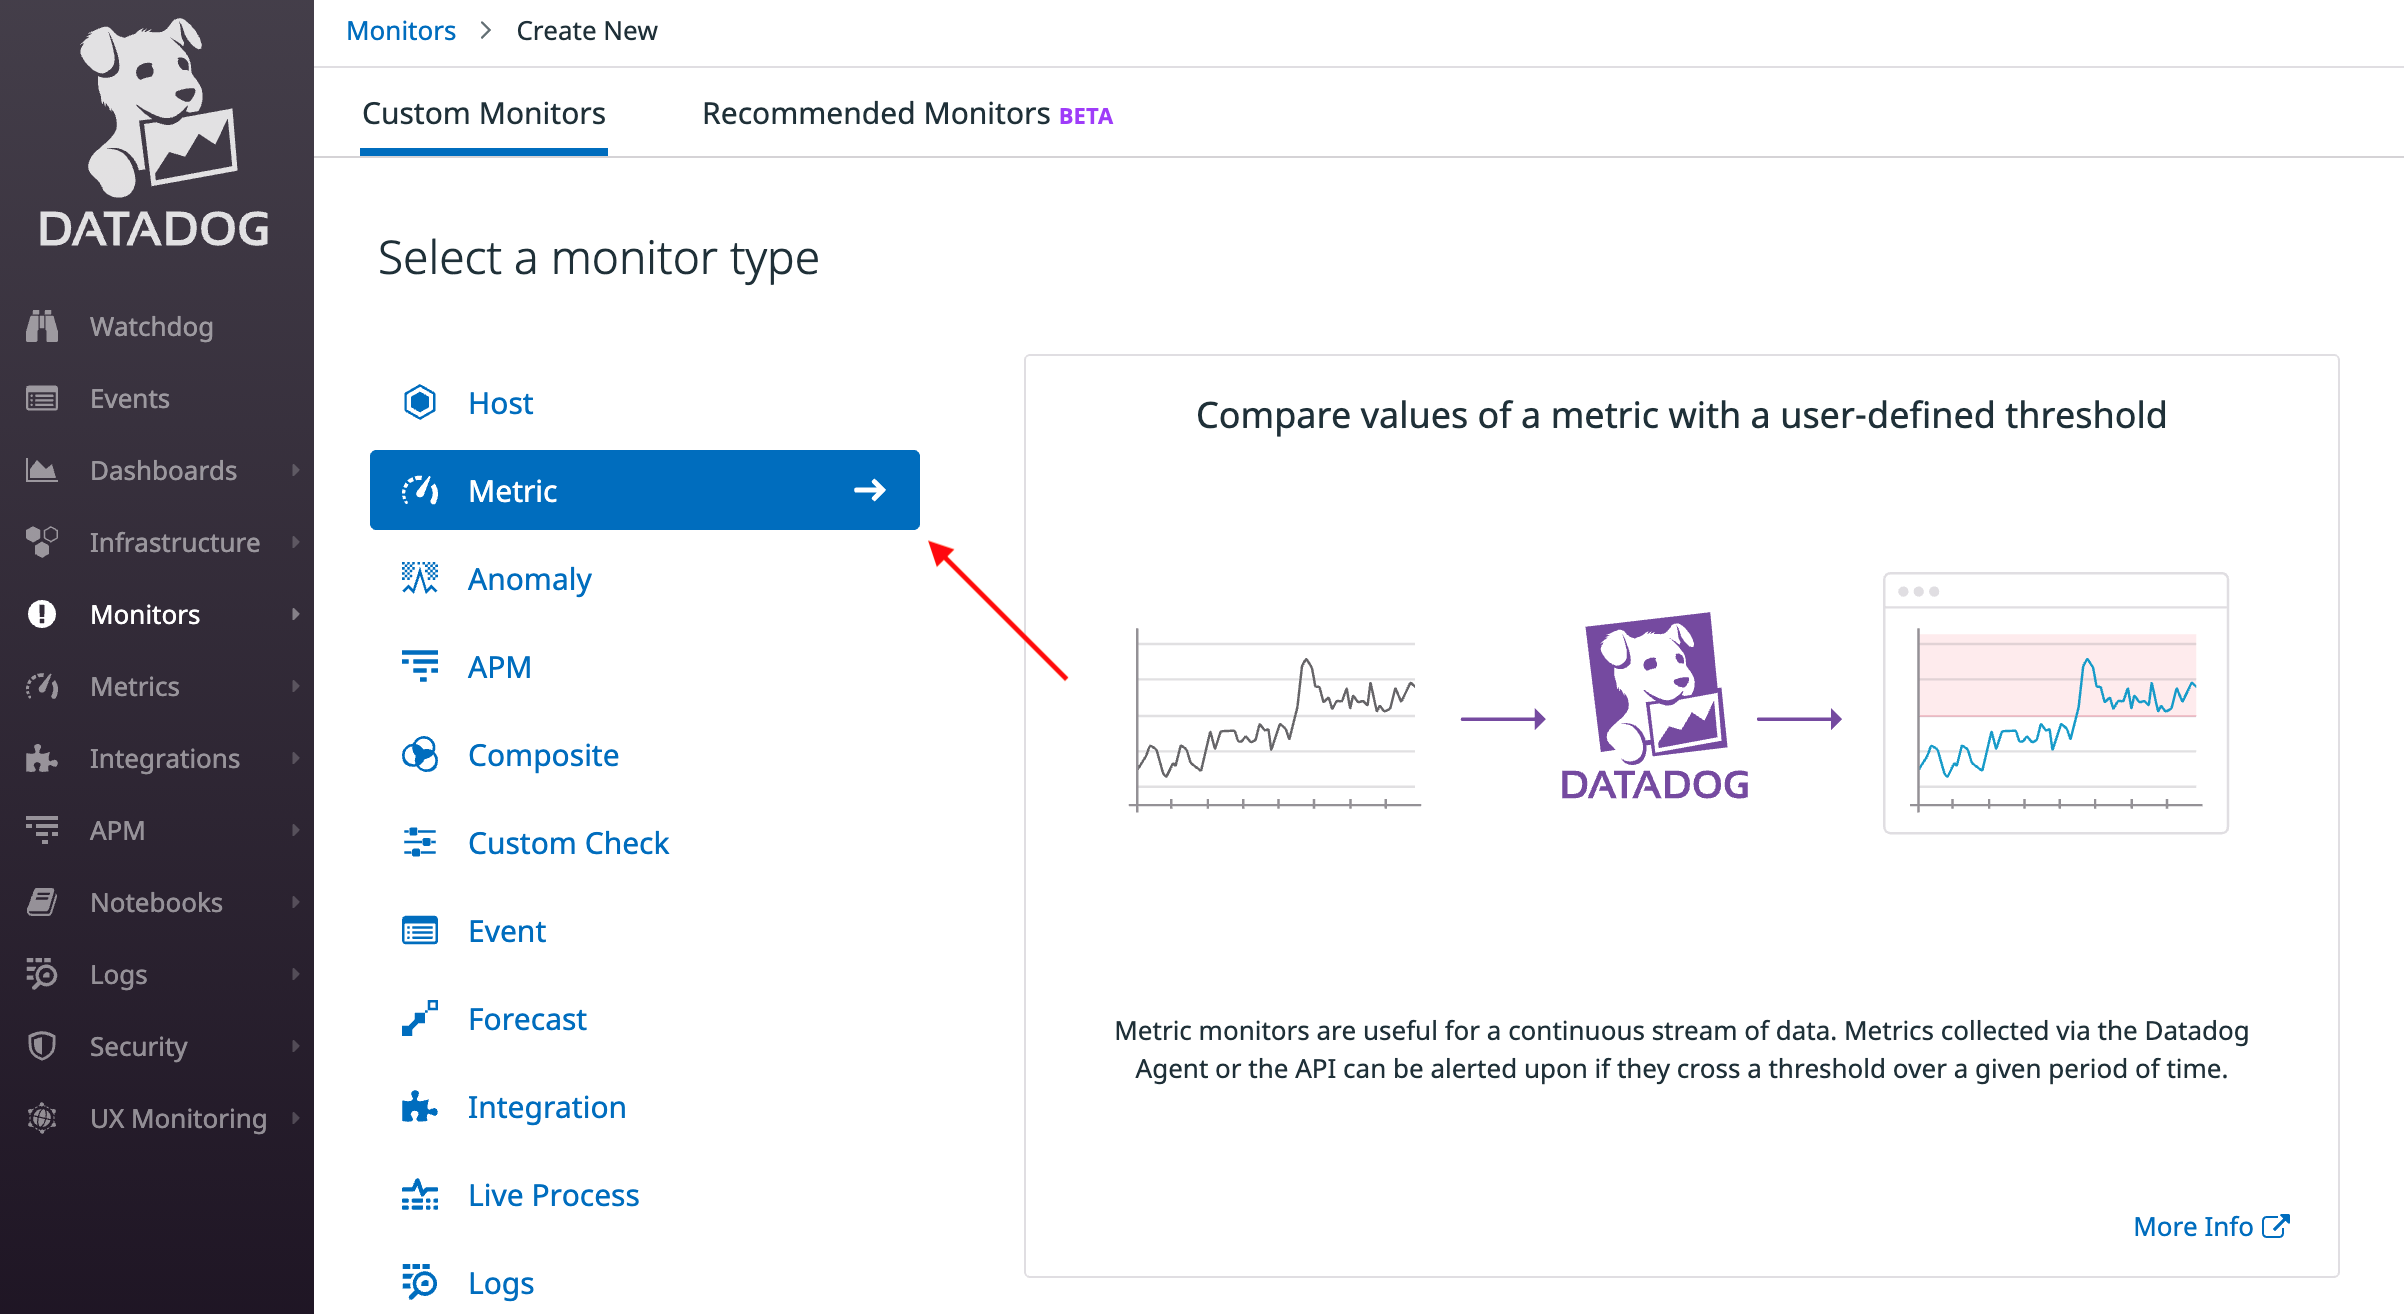
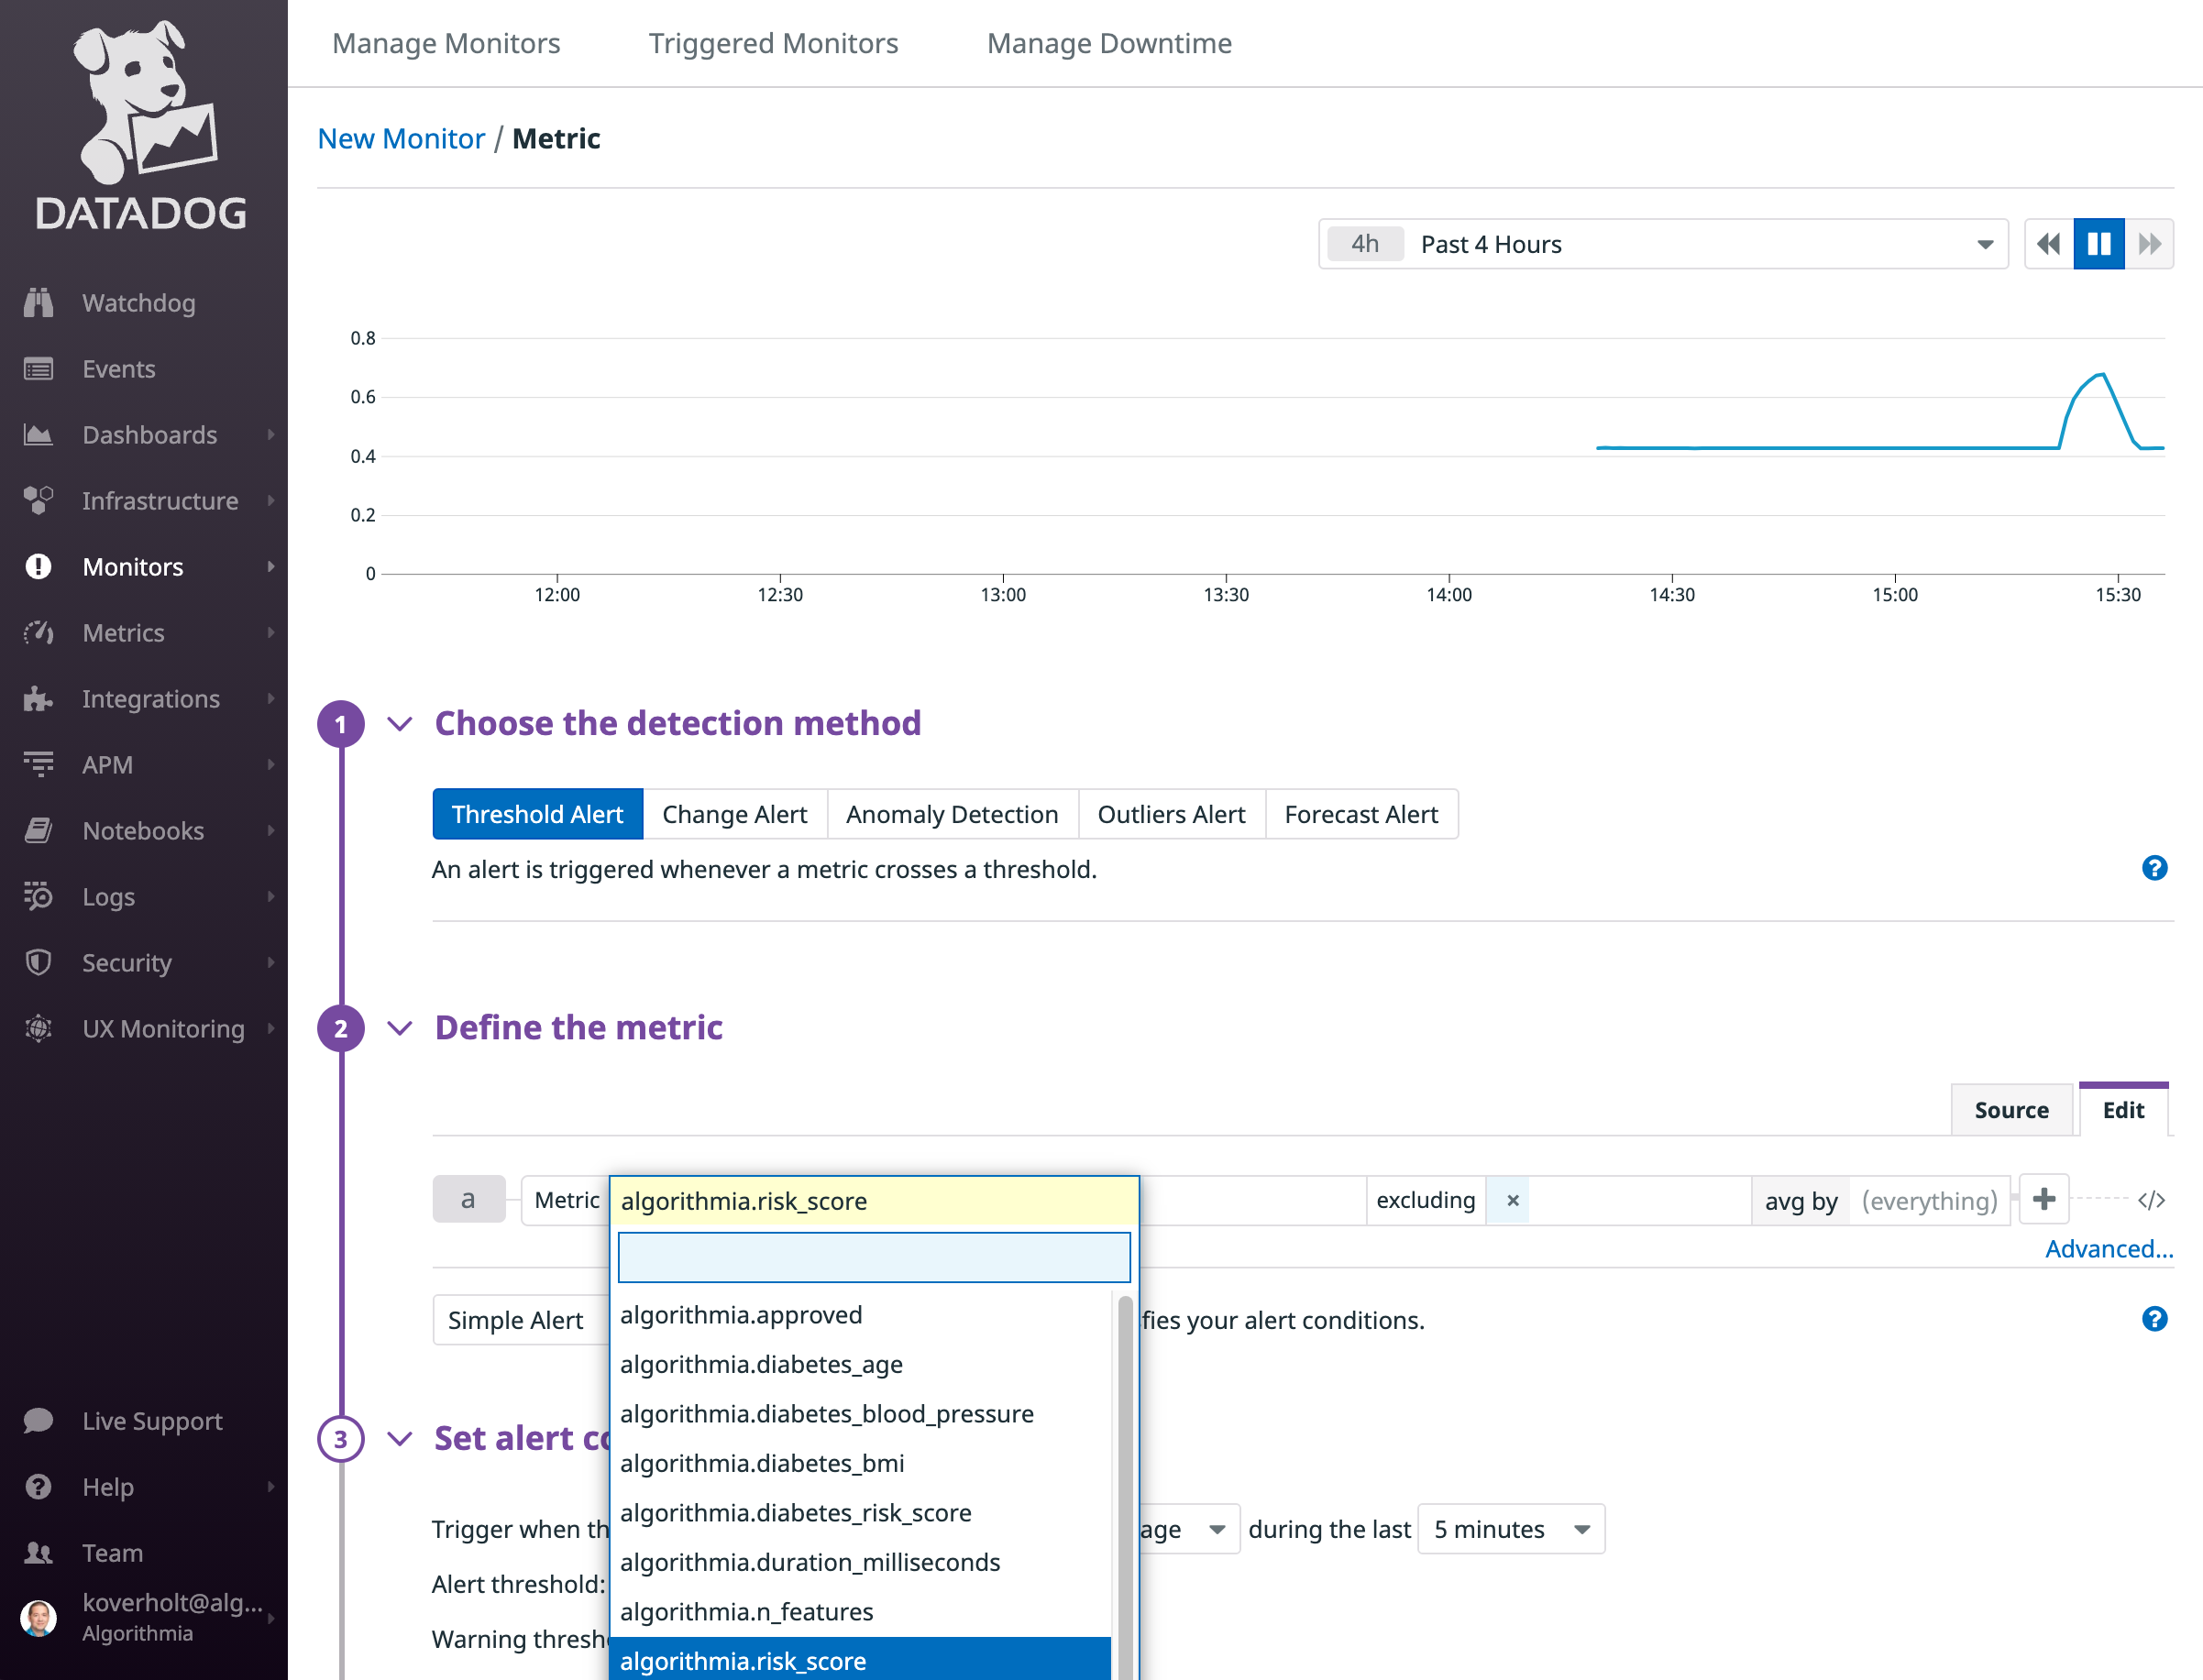
Select Metric as the Monitor Type:
In the Define the metric configuration section, select the metric that you want to display from the list of metrics that start with the prefix algorithmia . For example, we’ll choose the custom algorithmia.risk_score metric that we defined in a model (or you could choose the default operational metric named algorithmia.duration_milliseconds):
Set an alert threshold, monitor name, monitor message, notification settings, and any other desired configuration settings, then click on the Save button at the bottom of the monitor configuration page:
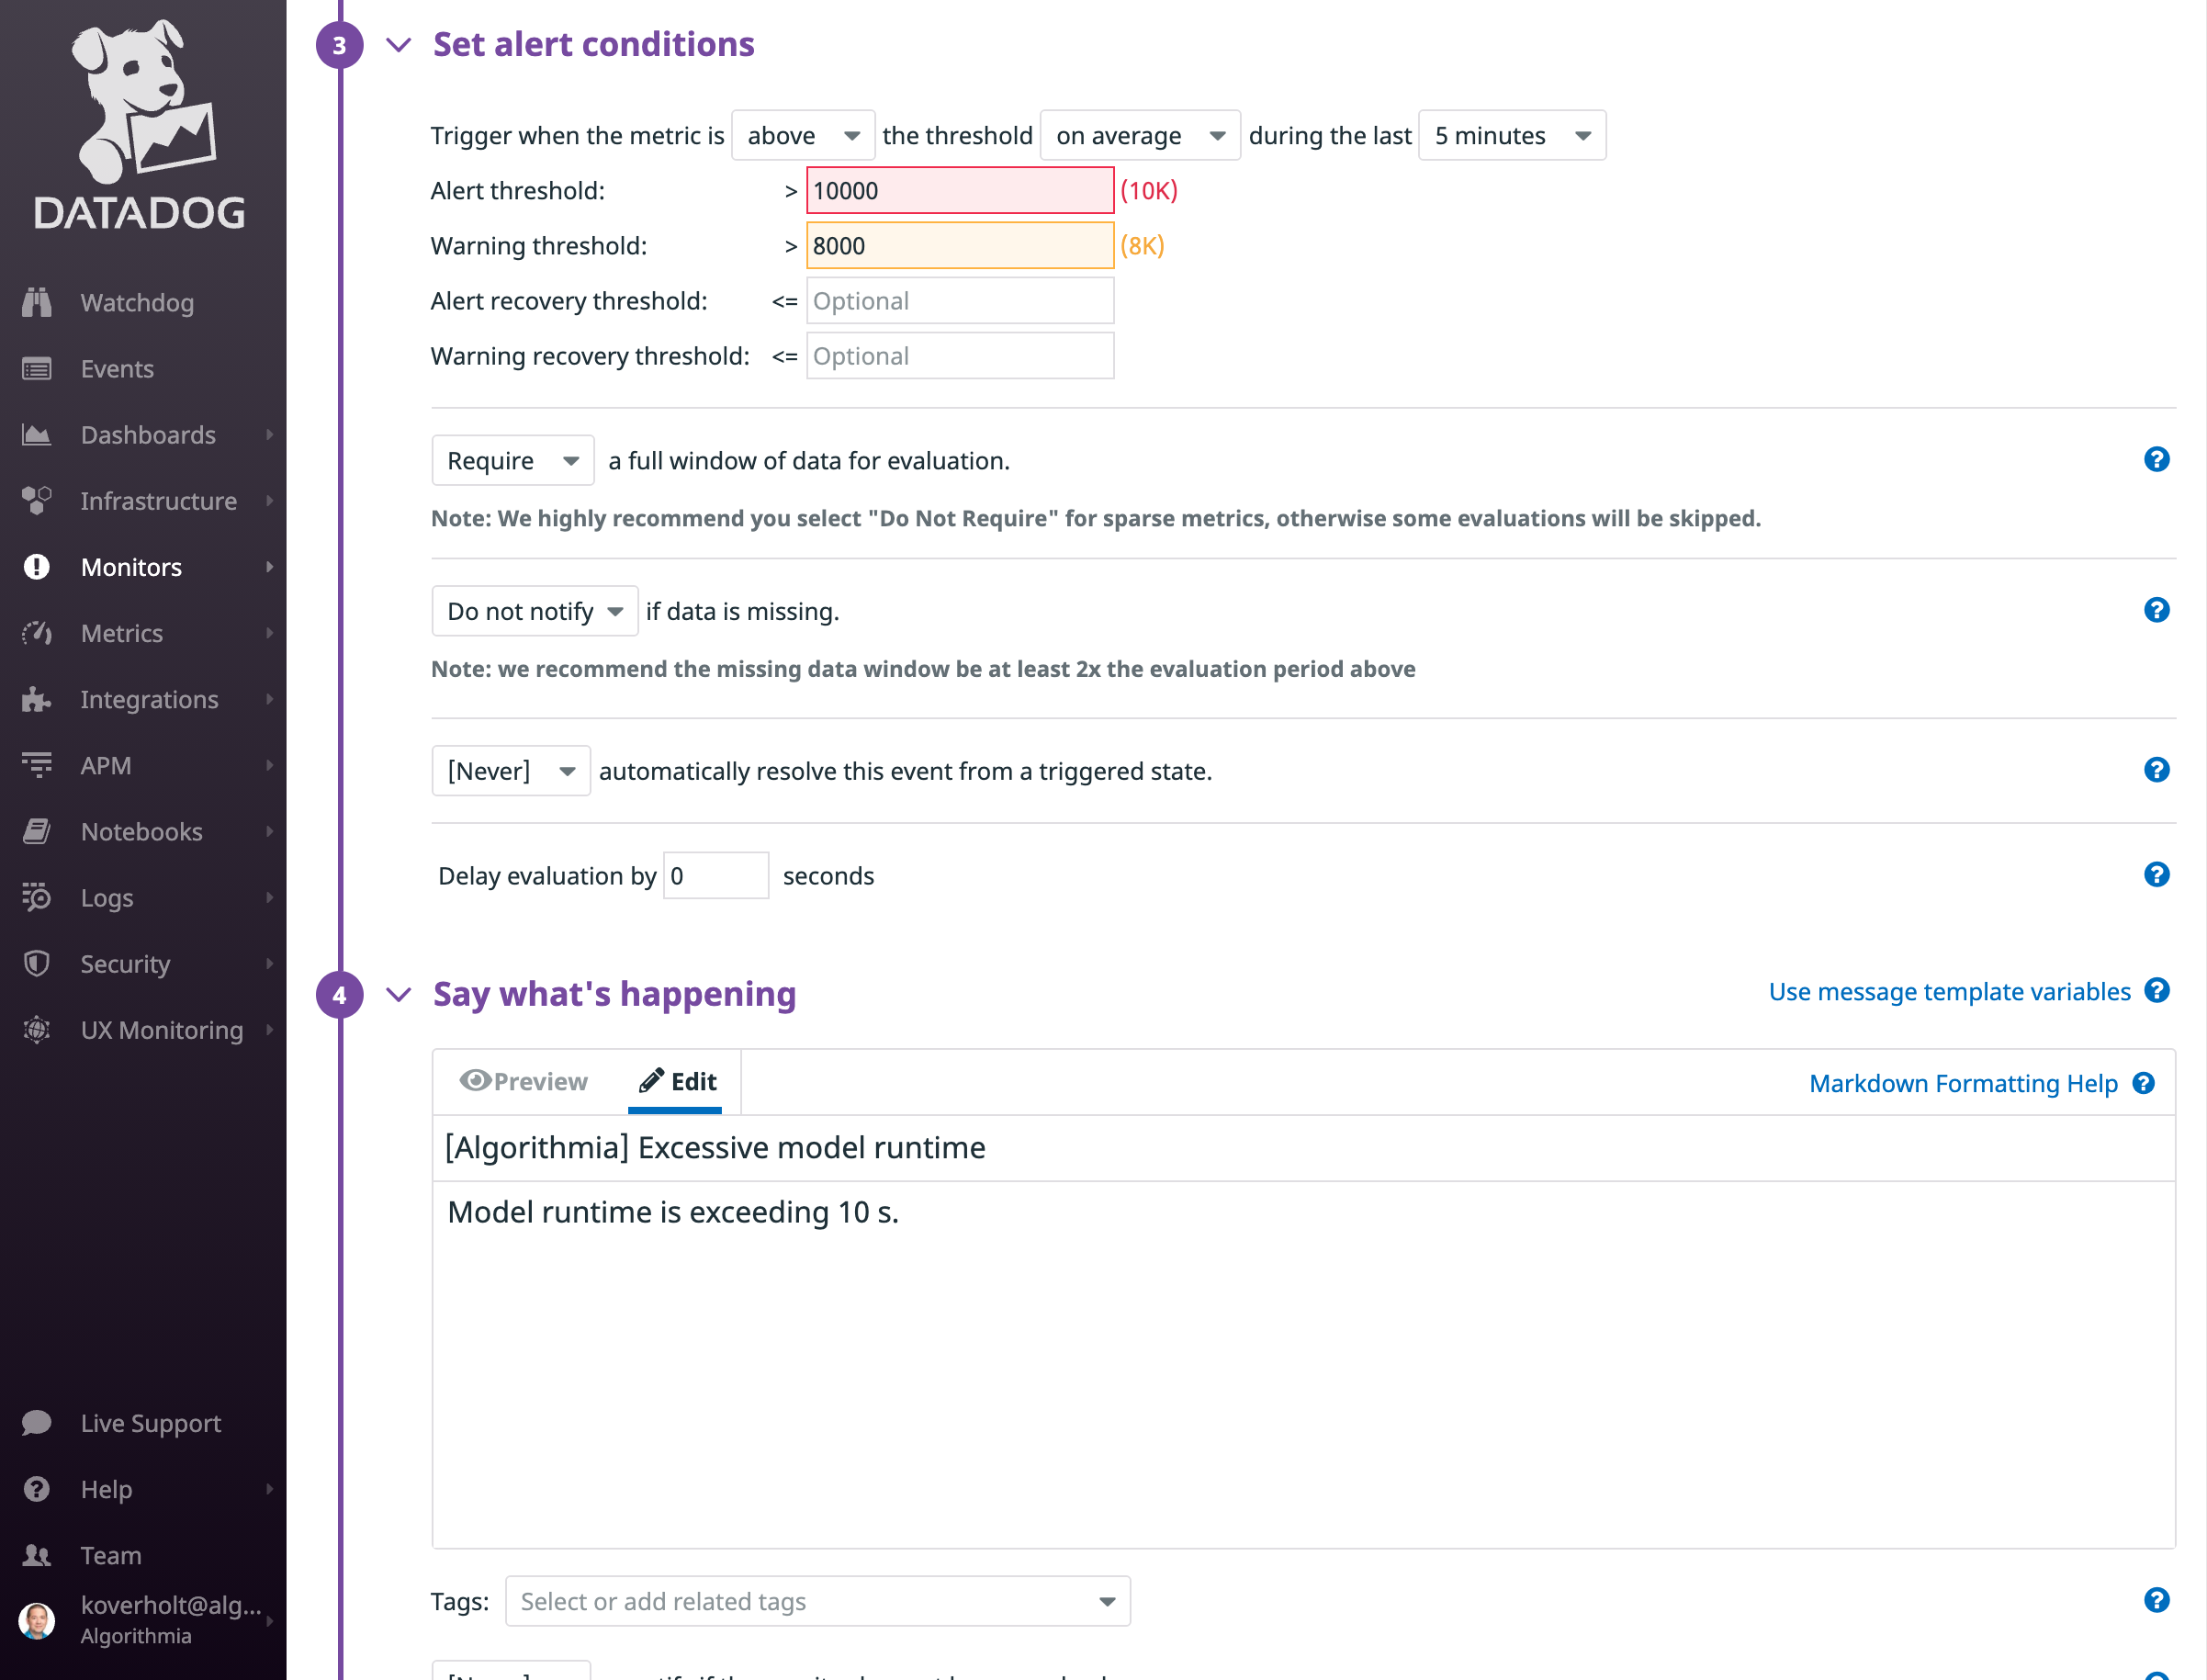
When your metrics from Insights exceed the specified threshold value, you’ll receive an alert that includes guidance on what actions need to be taken. Depending on your use case, you might want to configure notifications for email, Slack, PagerDuty, or other notification systems, and your suggested actions might include retraining and publishing a new version of a model, rolling back to an older version of a model, or other actions to mitigate model risk.
Example: Comparing performance metrics between model versions
The Algorithmia-Datadog integration sends operational metrics as tags, which can be used to filter and group model performance metrics in dashboards and monitors. Operational metrics include the algorithm name, version, owner, session ID, and request ID. In this example, we’ll demonstrate the use of tags in Datadog to compare metrics between model versions.
Create a new dashboard by following the steps in the earlier section to create a dashboard (or, you can edit an existing dashboard). Add a new widget (or edit an existing widget) and navigate to the Graph your data configuration section.
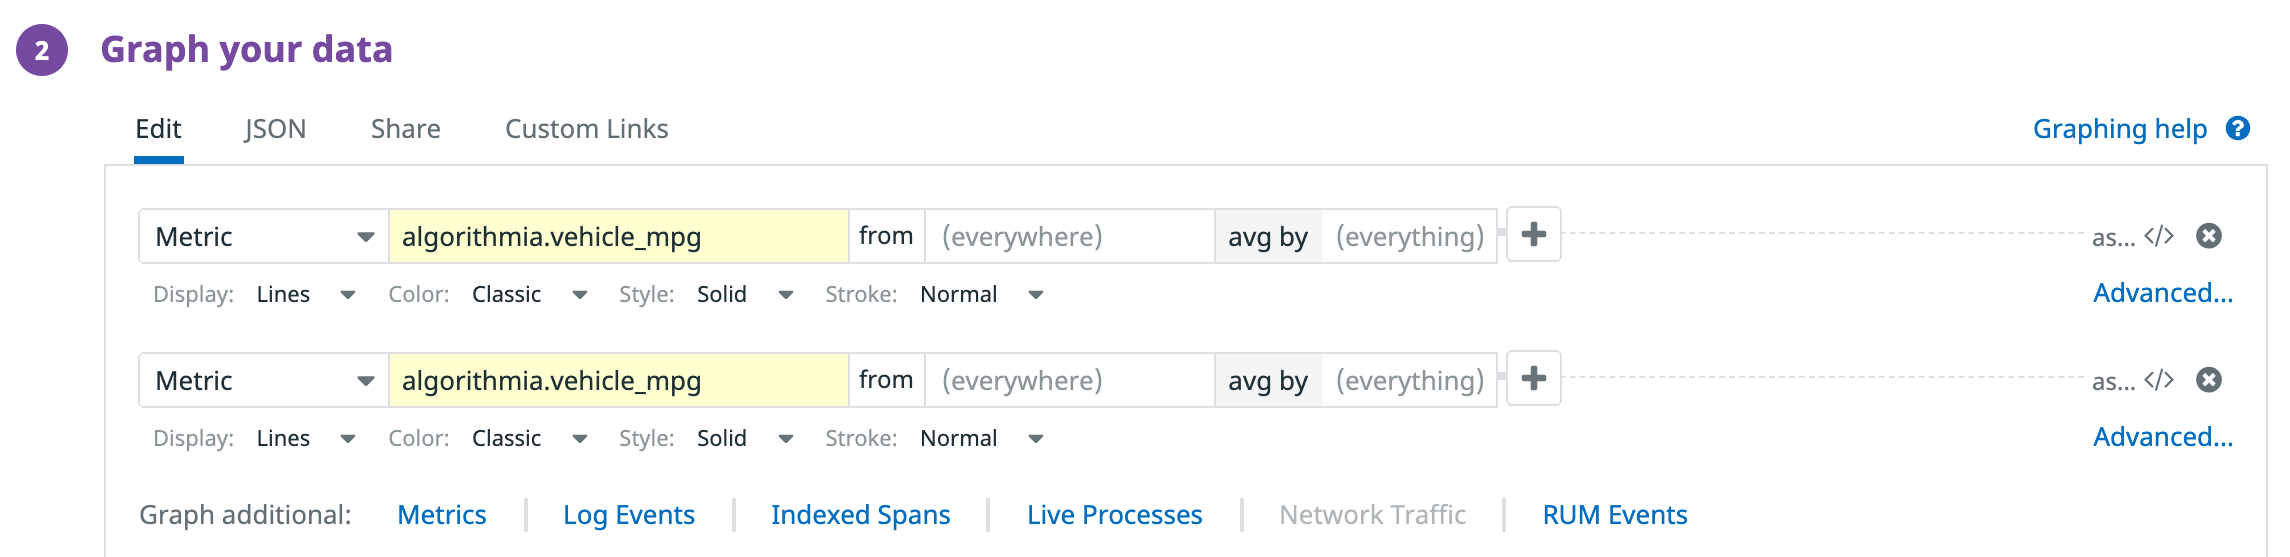
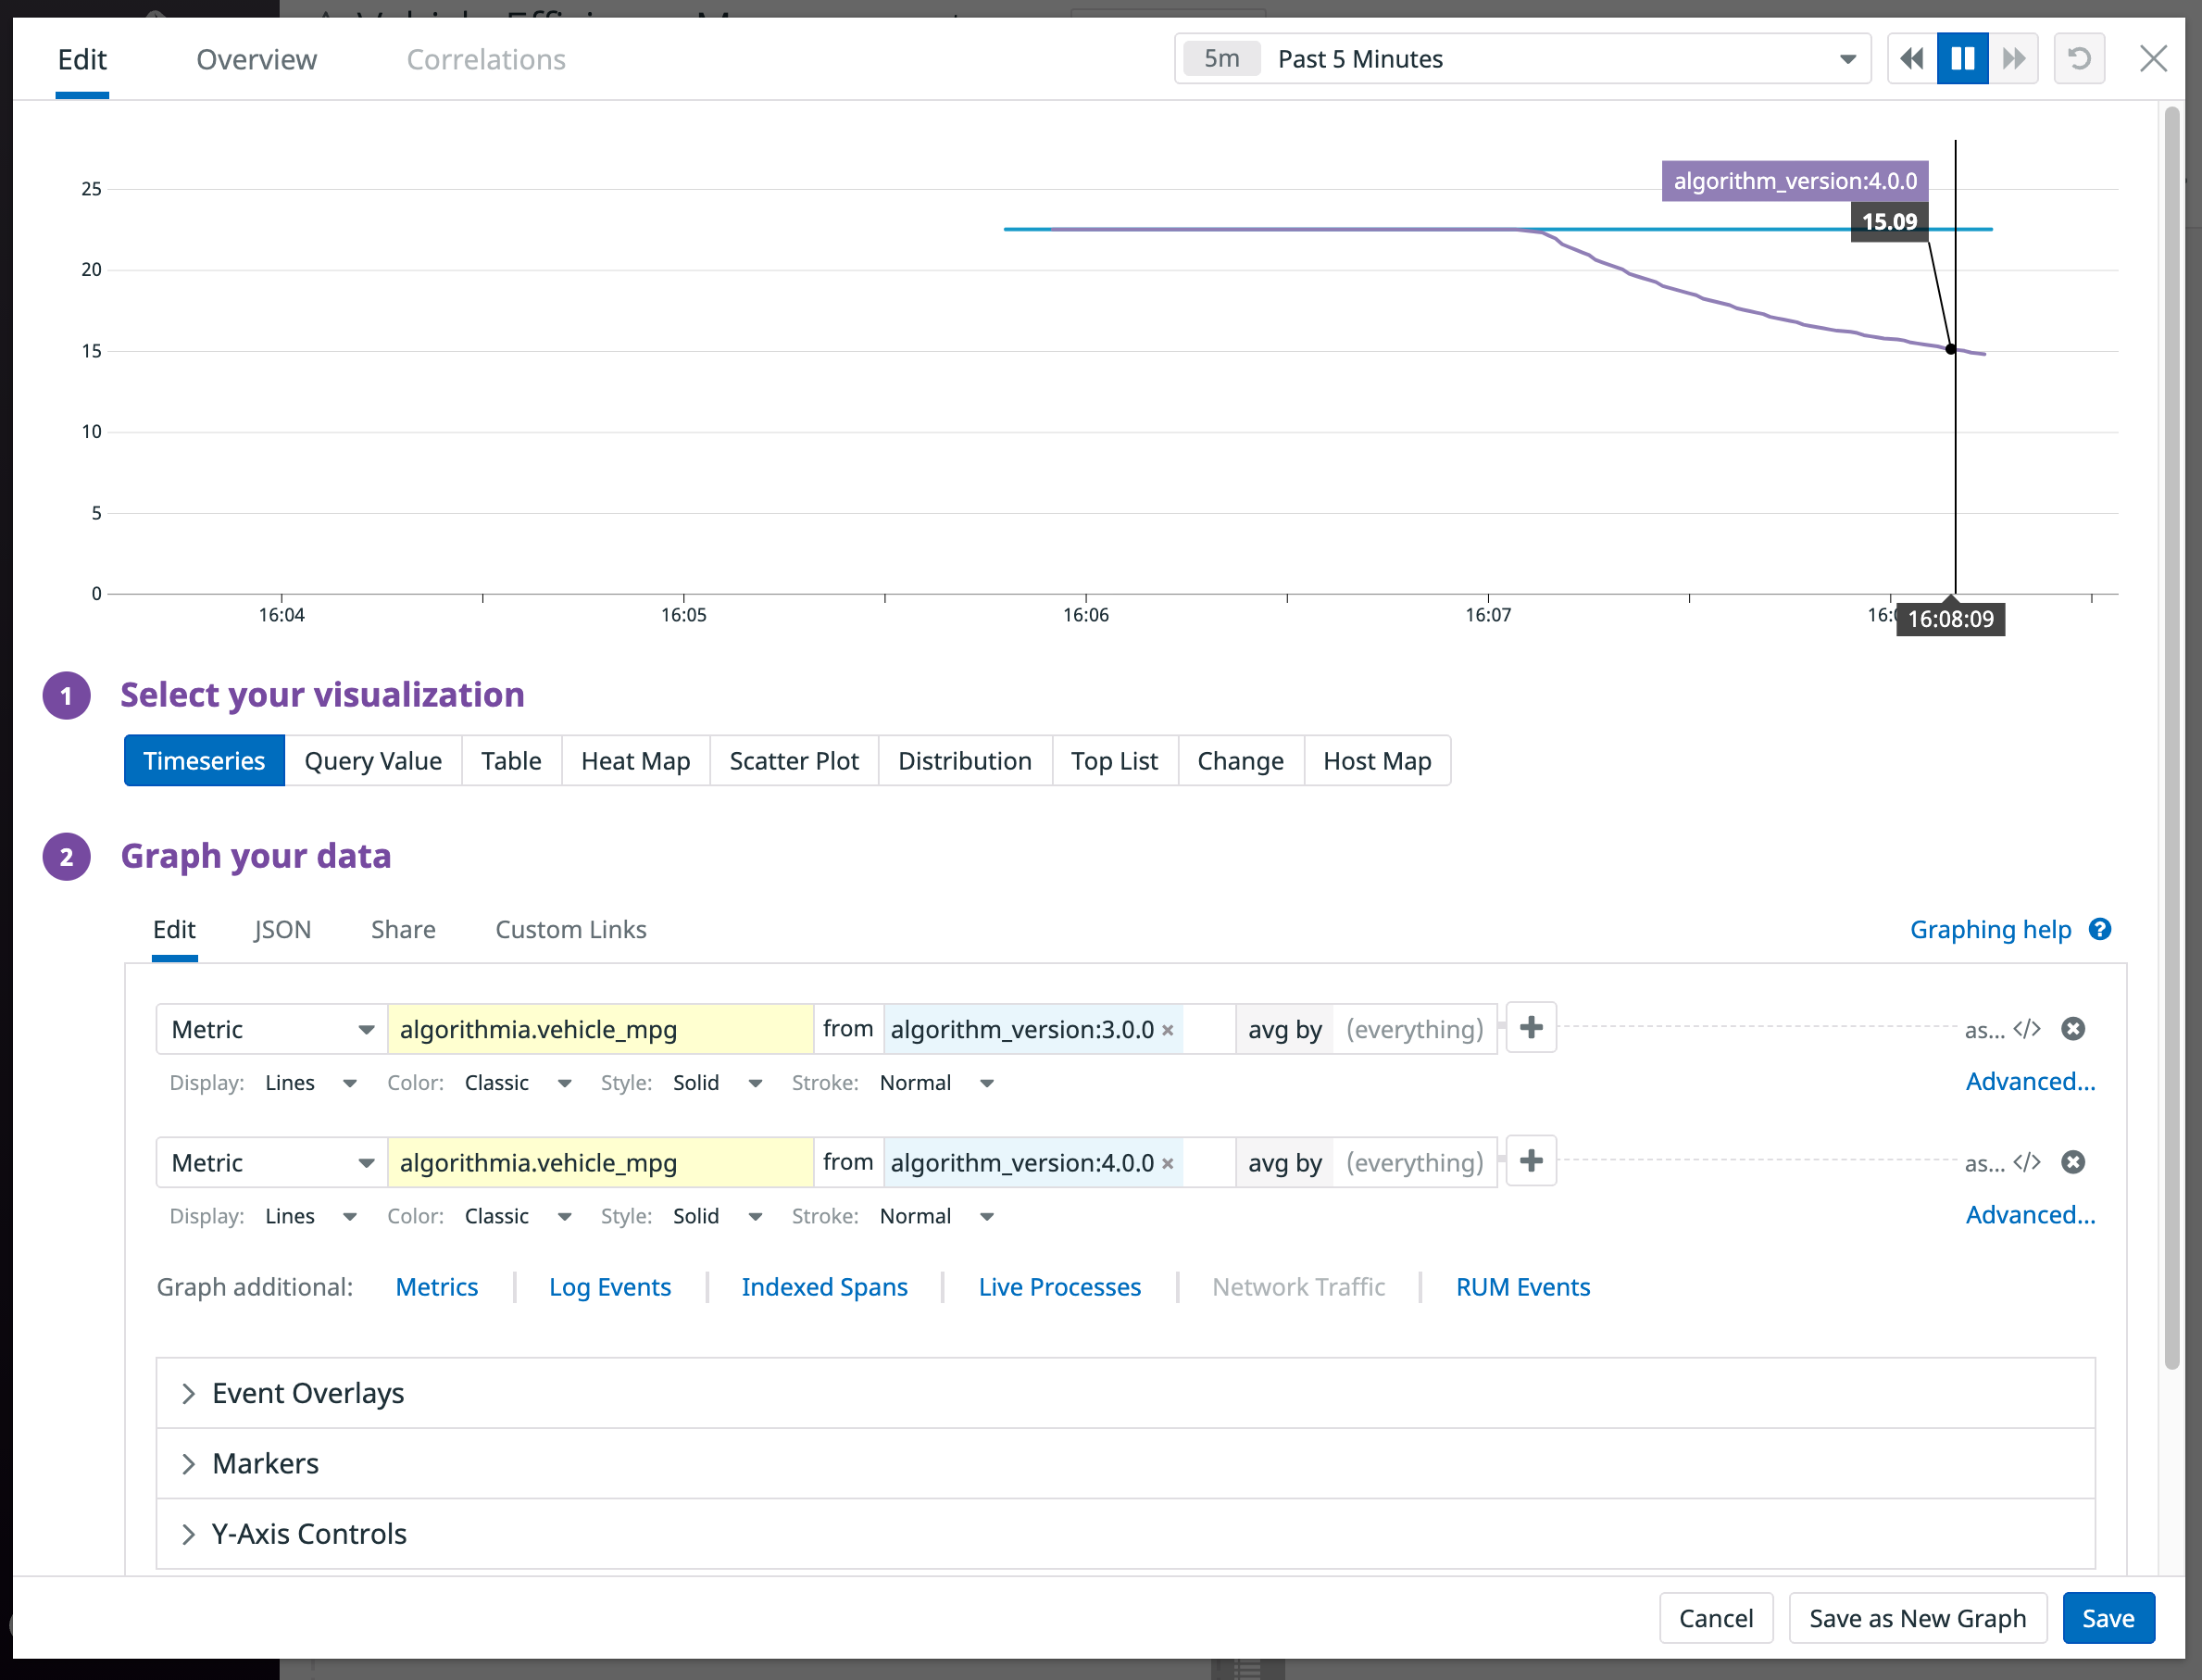
Using Graph additional option, choose Metrics, then select the same metric twice from an algorithm that has data from at least two versions that you want to compare:
Using the from field for each metric, select two different model versions that you want to compare by filtering for algorithm_version:<X.Y.Z>, where X.Y.Z corresponds to your algorithm versions:
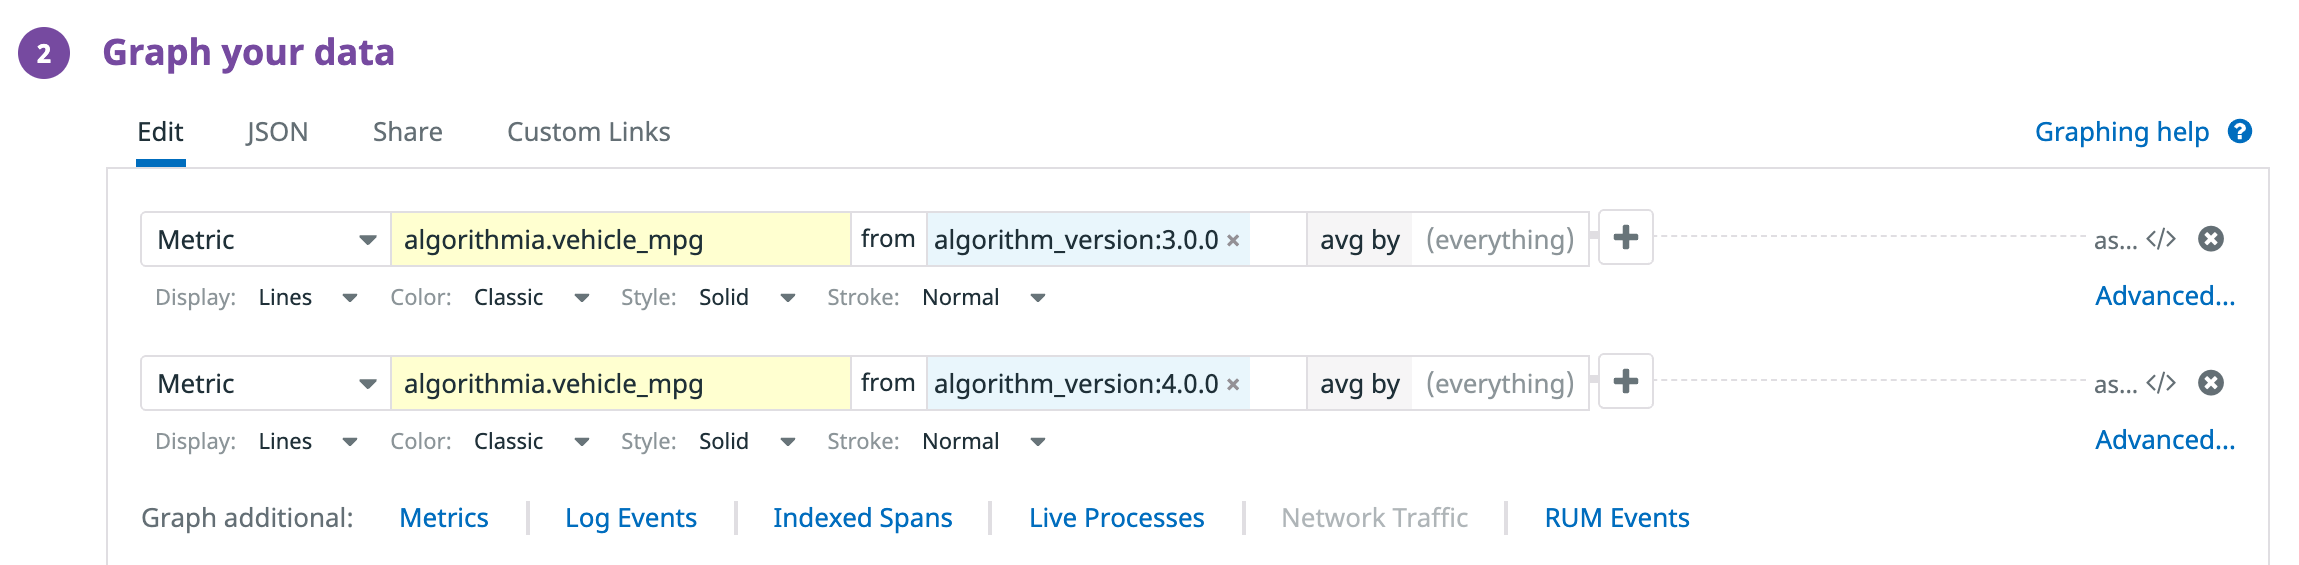
Now when you view your dashboard, you should see different series in the graph for each version that you specified in the previous step:
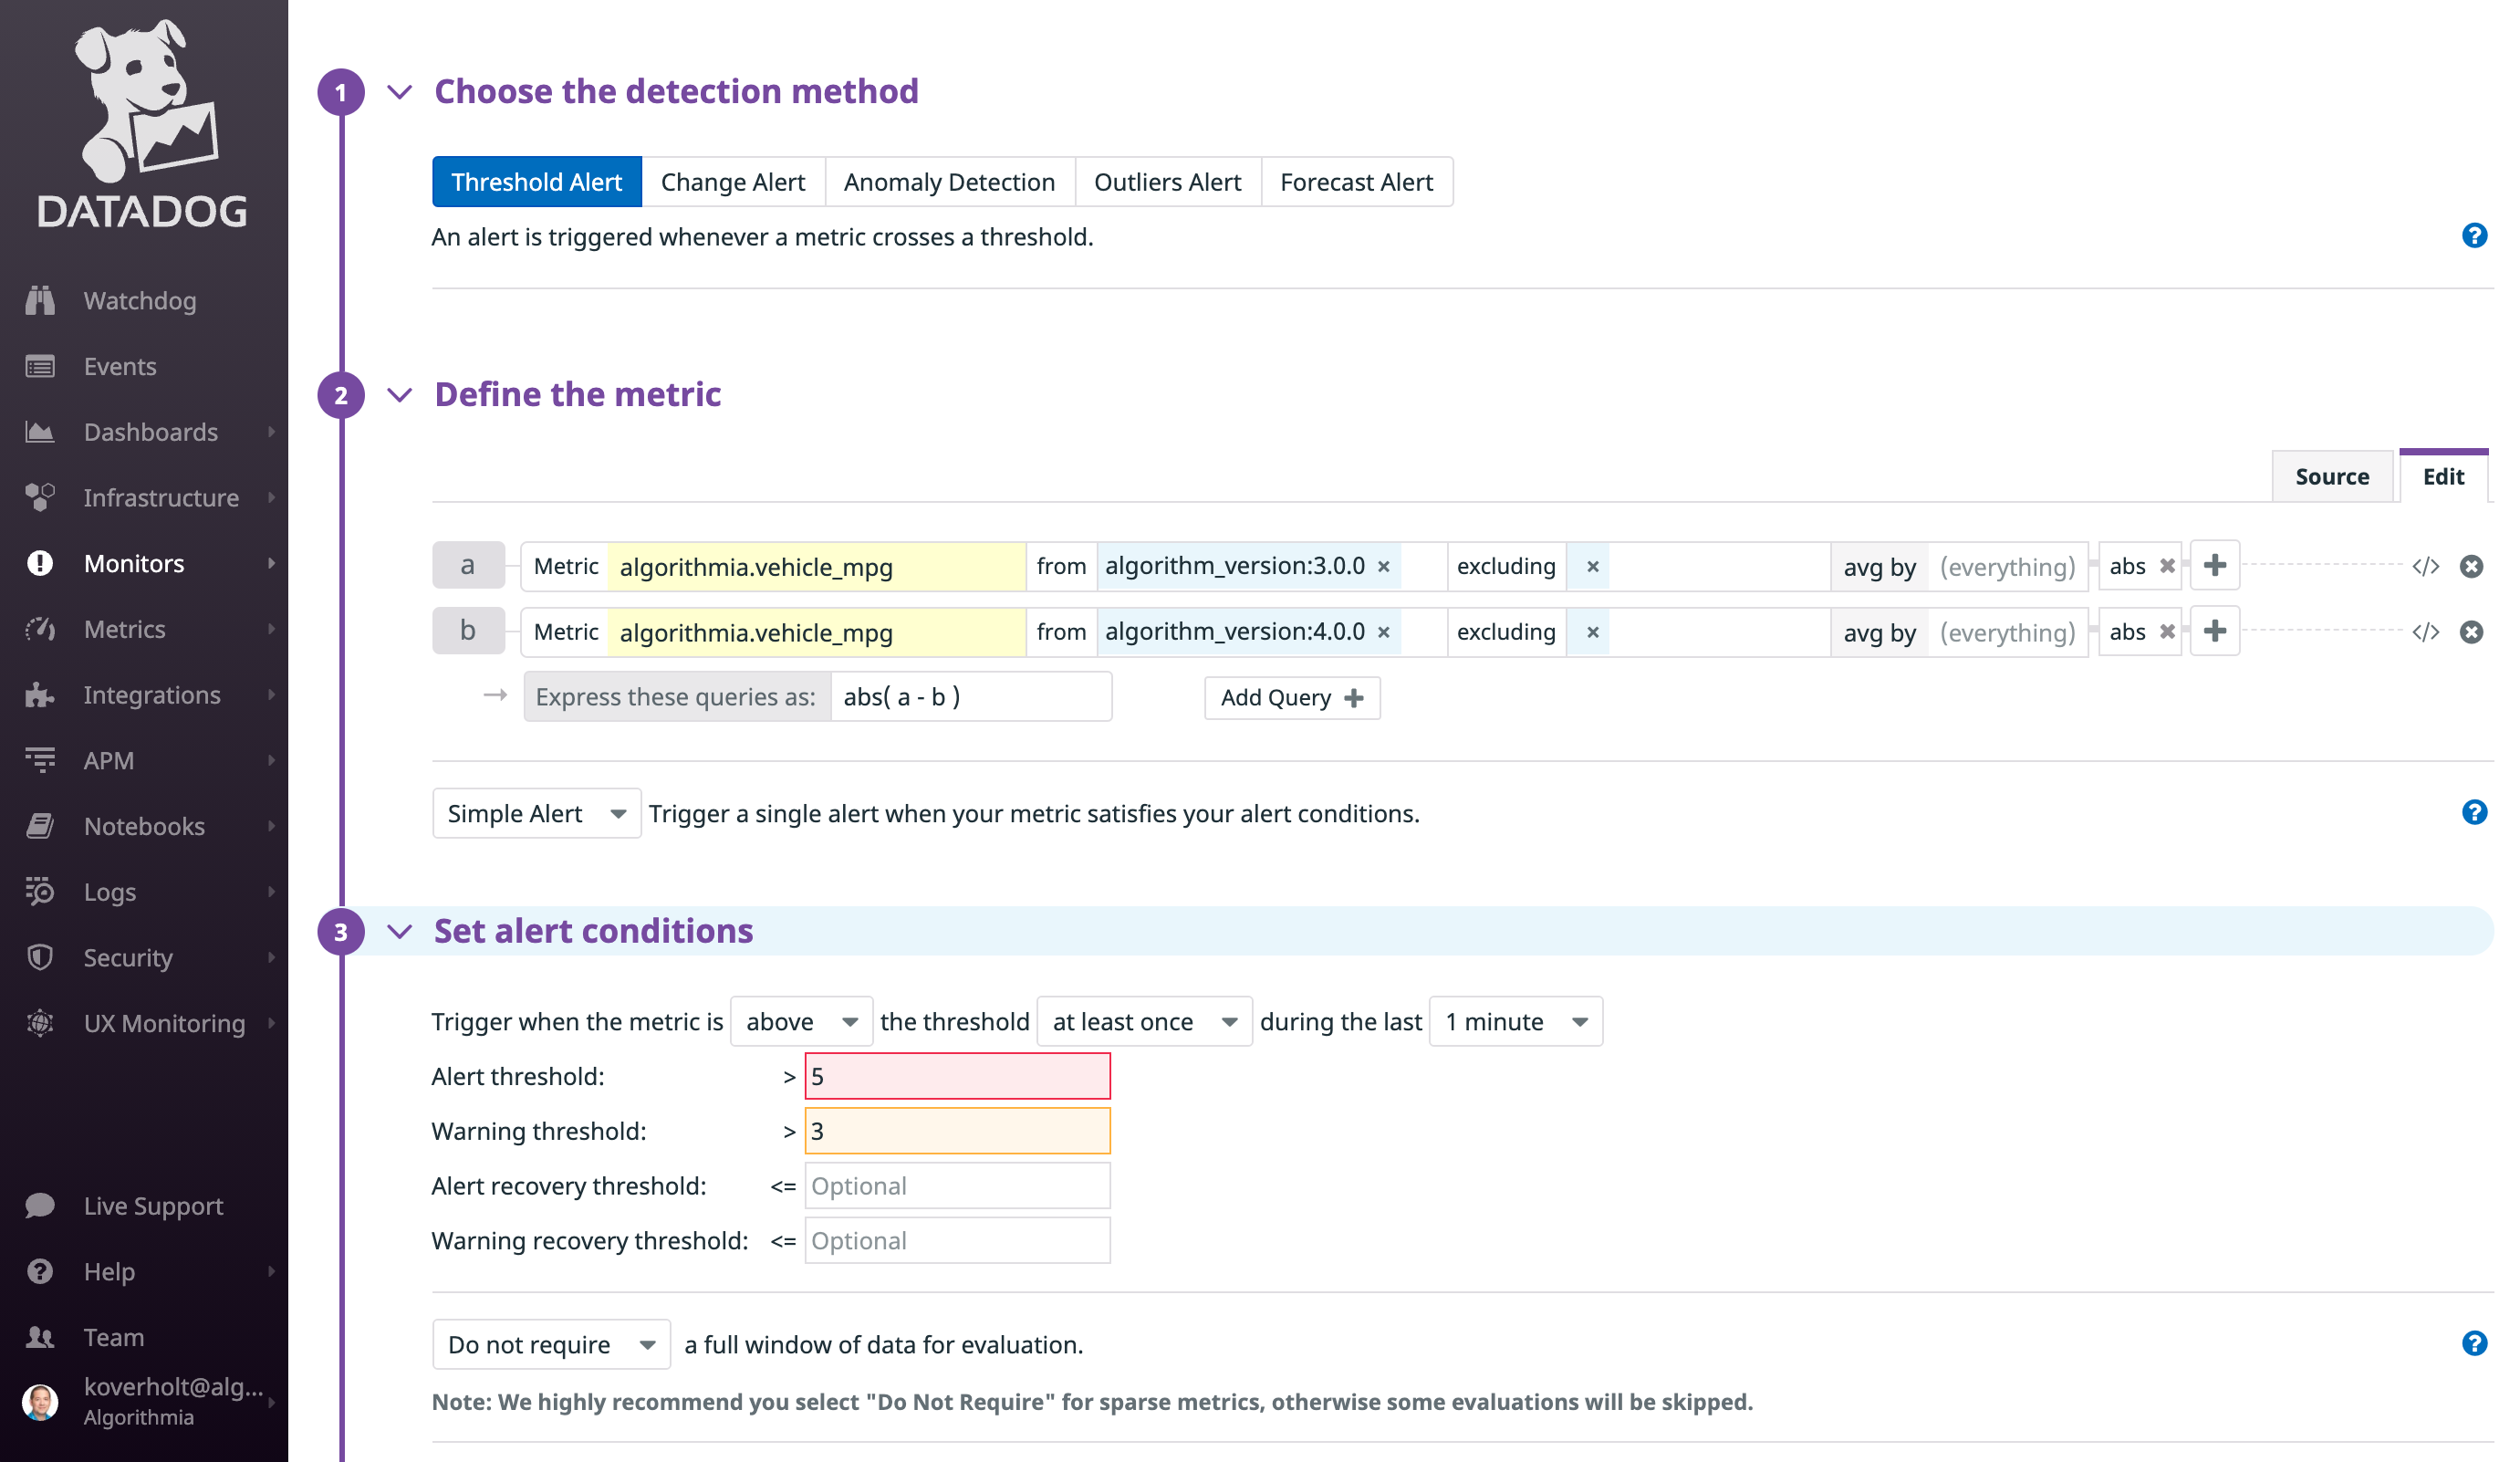
You can also set monitors and alerts for calculated metrics that measure differences between versions. For example, the following monitor is configured with a threshold alert that will be triggered when the difference between two model versions exceeds a specified value:
You can use the same approach with tags to filter metrics by version, name, or owner and compare different metrics from Insights in your dashboards and monitors.
Summary
Algorithmia Insights makes it easy to monitor and alert on model performance metrics by integrating with popular observability platforms such as Datadog. The examples and use cases described in this post demonstrate how you can develop dashboards and alerts to monitor model performance metrics in production systems across your entire model catalog. You can use this integration and the examples described here to create initial dashboards and alerts, then implement additional monitoring functionality such as anomaly detection, heat maps, change alerts, forecast alerts, and other capabilities from Datadog. Get started with the Algorithmia-Datadog integration by visiting the integration page on Datadog and repository on GitHub and following the documented steps.
If you’re new to Algorithmia and would like to learn more about our product and model and performance monitoring capabilities and integration with Datadog, please contact our sales team. We’d love to hear from you!