New Relic
This feature is available to Algorithmia Enterprise users only.
Algorithmia Insights is a feature of Algorithmia Enterprise that provides a metrics pipeline to instrument, measure, and monitor your machine learning models by integrating with popular observability platforms such as New Relic. If you’re new to Insights, check out our cluster admin docs and learn how to configure this feature for your organization.
New Relic is a cloud-based observability platform that helps you instrument, analyze, troubleshoot, and optimize your entire software stack. Using Insights, you can send your model performance data to New Relic as time-series data, enabling real-time model monitoring.
With your dashboards, monitors, and alerts on New Relic you can analyze your model performance metrics in production systems across your entire model catalog.
How the Algorithmia-New Relic integration works
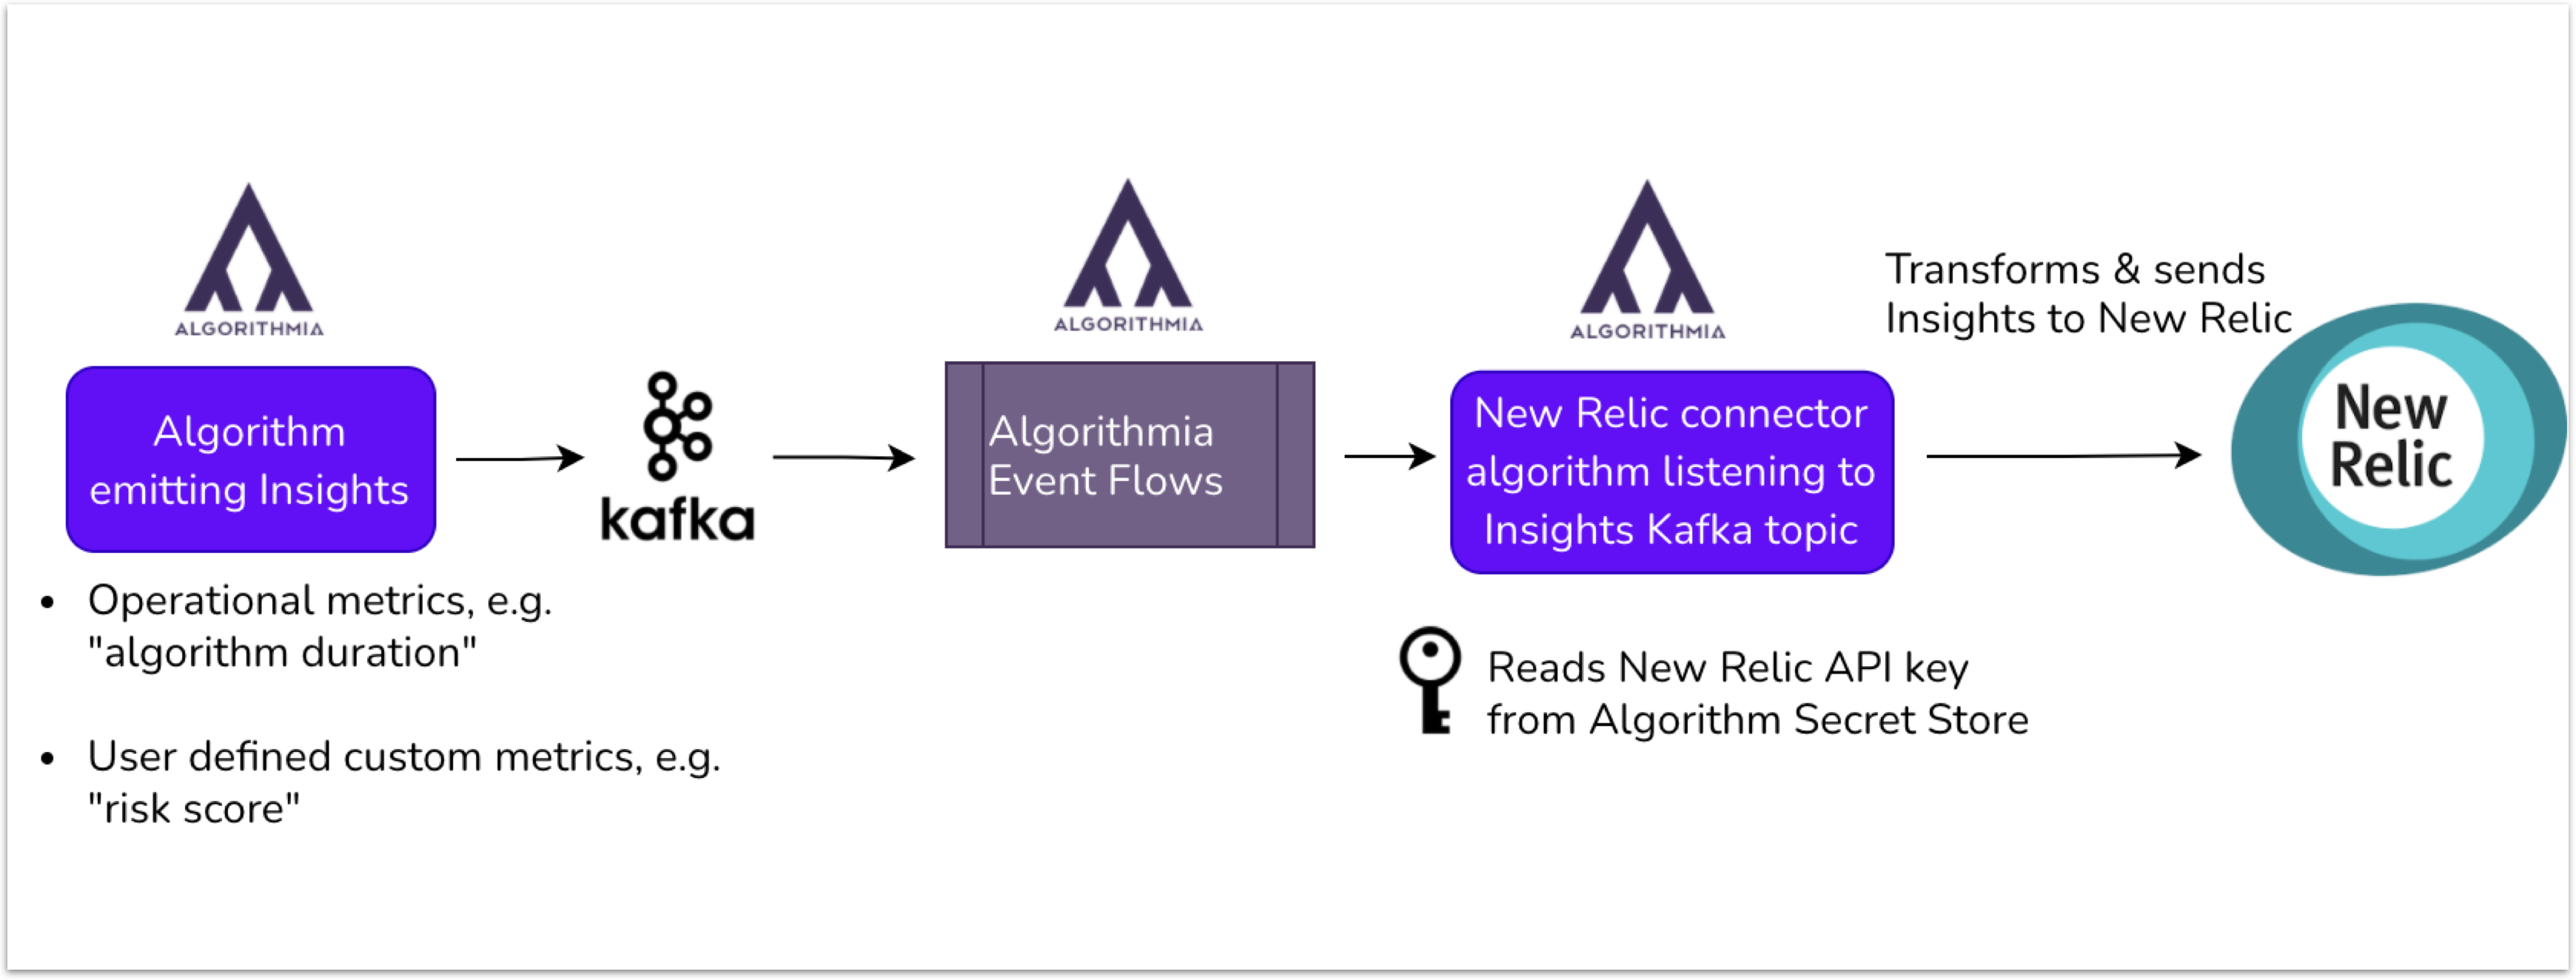
In this workflow, your algorithm’s metrics are streamed to a Kafka topic using Algorithmia Insights. You have another algorithm—the New Relic connector—that can transform and send any Insights payload to New Relic Metrics for the configured account. Using Algorithmia Event Flows, your New Relic connector algorithm is configured to get called when a new message is sent to your Kafka topic collecting Insights.
With this event flow, when your Insights-enabled algorithms are run, the New Relic connector algorithm gets called with your algorithms’ Insights payloads. The connector algorithm then transforms your Insights metrics and sends them to your New Relic account.
Setup
To set up this integration, you will need to:
- Create an account on New Relic and retrieve your API key. See the Get your API key section below for details.
- Create your default Algorithmia dashboard on New Relic. You can import our default dashboard and start observing your algorithm duration and throughput right away.
- Configure Algorithmia to send Insights to a Kafka broker and topic.
- Create the New Relic connector algorithm, and add your New Relic API key to your algorithm’s secrets.
- Set up Algorithmia Event Flows for your New Relic connector algorithm.
For any published algorithm on your cluster that has Insights enabled, once the algorithm’s API endpoint is called, your New Relic connector algorithm will in turn be called through the Algorithmia Event Flows trigger. The connector algorithm will then push your Insights metrics to your New Relic Account.
As you call your Insights-enabled algorithms, you can then verify that your metrics appear in New Relic as algorithmia.<METRIC-NAME> and that your data points are plotted on your New Relic dashboard’s charts.
Monitored metrics
The metrics payload from Algorithmia Insights contains both operational and inference metrics. Operational metrics include the algorithm name, version, owner, duration, session ID, and request ID. Inference metrics include user-defined metrics that are specified by data scientists depending on the particular algorithm and use case.
When this integration is used, all of the operational metrics related to the algorithm name, version, owner, request ID, and session ID will be included with each data point as attributes in New Relic. These attributes, or dimensions, can then be used to filter and group model performance metrics in dashboards.
Configuration details
New Relic
Get your API key
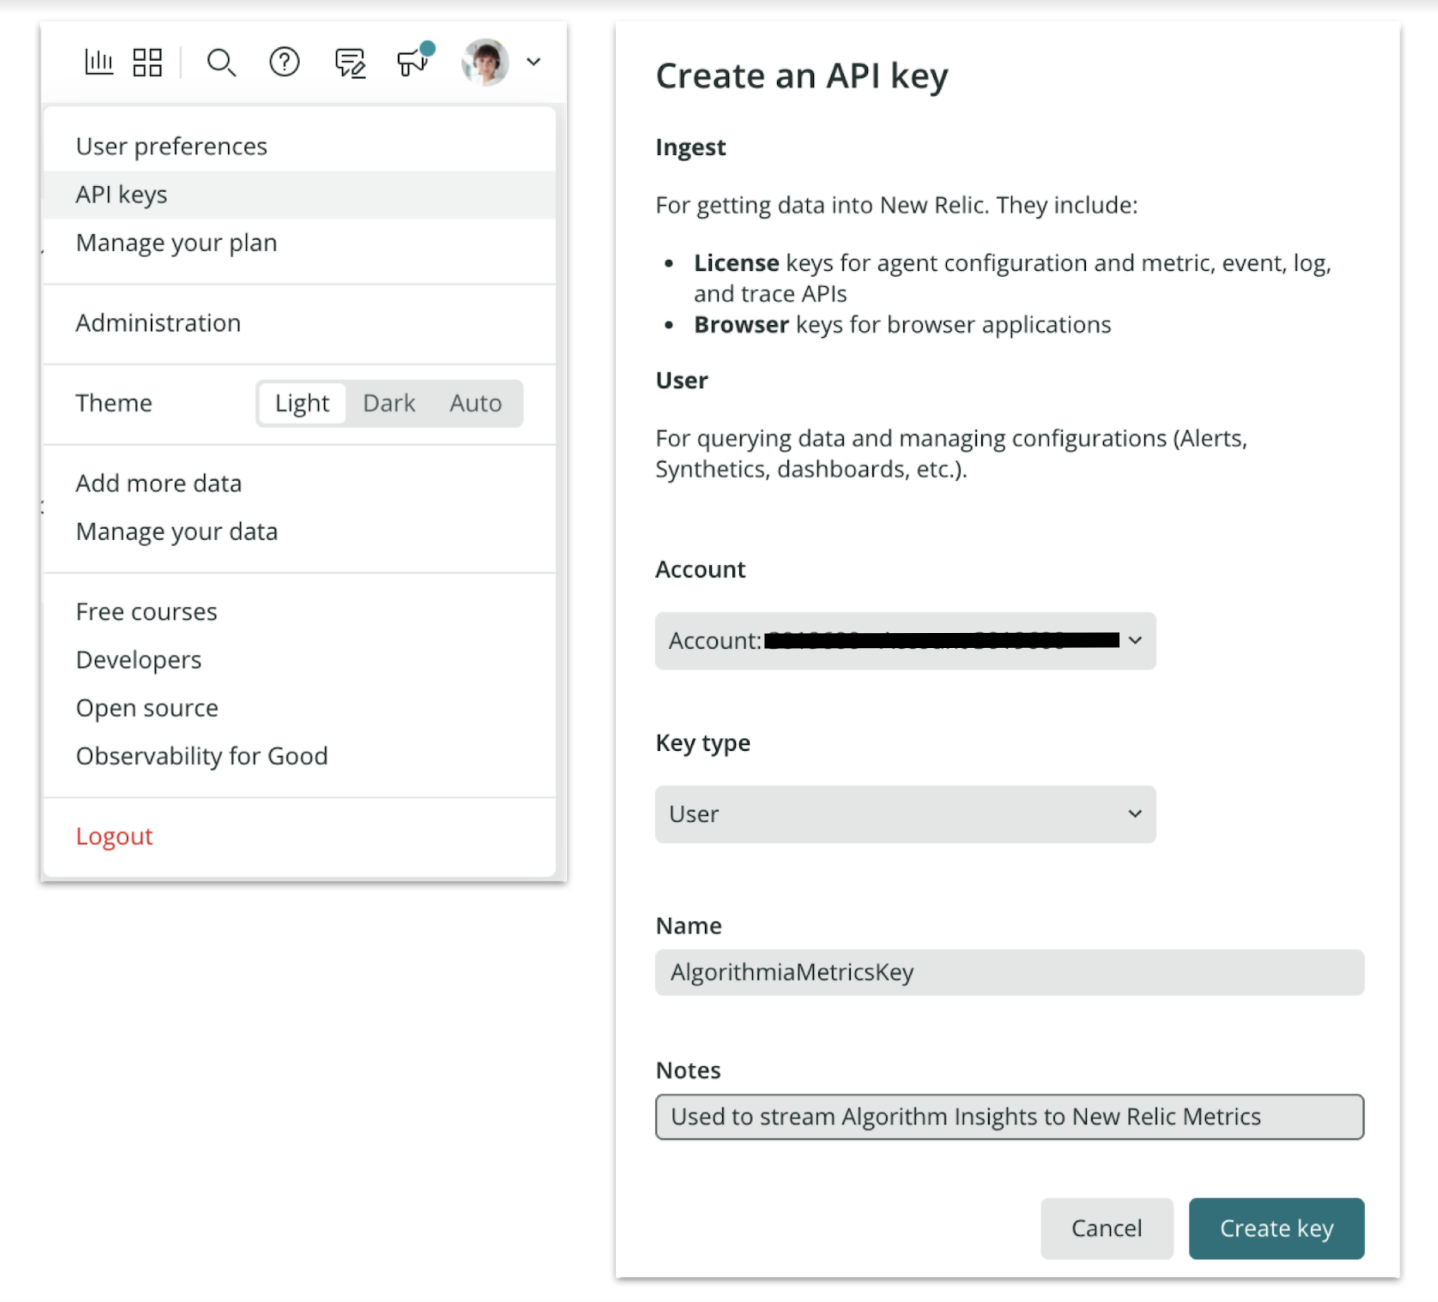
After logging in to your New Relic account, go to your profile and select API keys. Create a key with “User” as the key type and note it down for later reference for your Algorithmia-side configuration.
Create your default Algorithm dashboard
From your New Relic One main page, go to your main Dashboards page. From here you can either create a dashboard from scratch or start with Algorithmia’s default metrics dashboard.
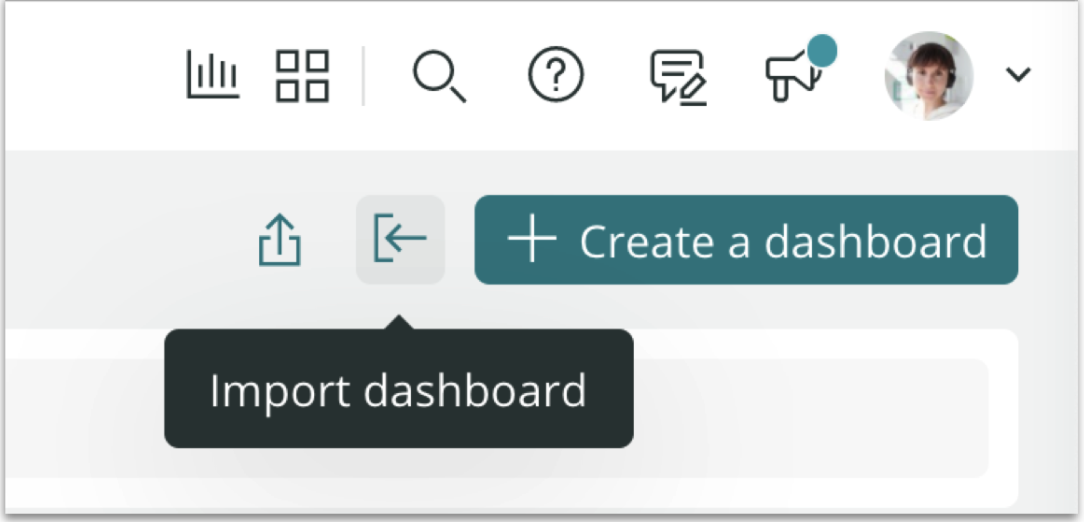
To get started with the Algorithmia template, click on the import dashboard (left-pointing arrow) button from the menu icons on the right.
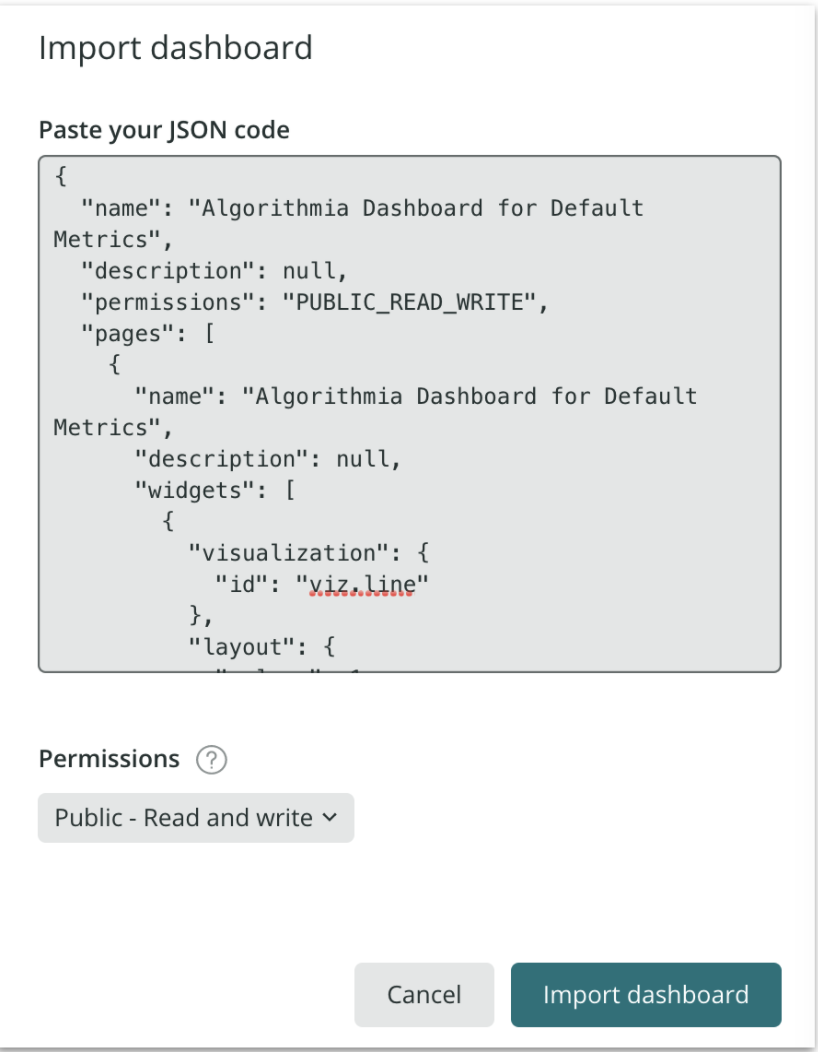
On the popup page, paste the following JSON. Remember to update the fields that say “accountId”: NEW_RELIC_ACCOUNT_ID with your own New Relic Account ID integer.
{
  "name": "Algorithmia Dashboard for Default Metrics",
  "description": null,
  "permissions": "PUBLIC_READ_WRITE",
  "pages": [
    {
      "name": "Algorithmia Dashboard for Default Metrics",
      "description": null,
      "widgets": [
        {
          "visualization": {
            "id": "viz.line"
          },
          "layout": {
            "column": 1,
            "row": 1,
            "height": 3,
            "width": 4
          },
          "title": "Runtime Duration by Algorithm",
          "rawConfiguration": {
            "legend": {
              "enabled": true
            },
            "nrqlQueries": [
              {
                "accountId": NEW_RELIC_ACCOUNT_ID,
                "query": "SELECT average(algorithmia.duration_milliseconds) FROM Metric TIMESERIES FACET `algorithm_name` LIMIT 10 SINCE 1800 seconds ago"
              }
            ],
            "yAxisLeft": {
              "zero": true
            }
          },
          "linkedEntityGuids": null
        },
        {
          "visualization": {
            "id": "viz.line"
          },
          "layout": {
            "column": 5,
            "row": 1,
            "height": 3,
            "width": 4
          },
          "title": "Throughput by Algorithm",
          "rawConfiguration": {
            "legend": {
              "enabled": true
            },
            "nrqlQueries": [
              {
                "accountId": NEW_RELIC_ACCOUNT_ID,
                "query": "SELECT count(algorithmia.duration_milliseconds) FROM Metric TIMESERIES FACET `algorithm_name` LIMIT 10 SINCE 1800 seconds ago"
              }
            ],
            "yAxisLeft": {
              "zero": true
            }
          },
          "linkedEntityGuids": null
        }
      ]
    }
  ]
}
Click on “Import dashboard” and get ready to observe your Algorithmia Insights metrics on these widgets.
Algorithmia
Configure Insights
To enable Insights, your Algorithmia cluster administrator must first connect your cluster to a Kafka broker to which metrics will be sent. Once this one-time configuration is complete, you can start using Insights in your algorithms.
Create New Relic connector algorithm
Create a new algorithm with a Python (3.7 and up) environment with the following source code and dependencies. If you’re new to creating algorithms, see our Getting Started guide.
Add New Relic API key to algorithm secrets
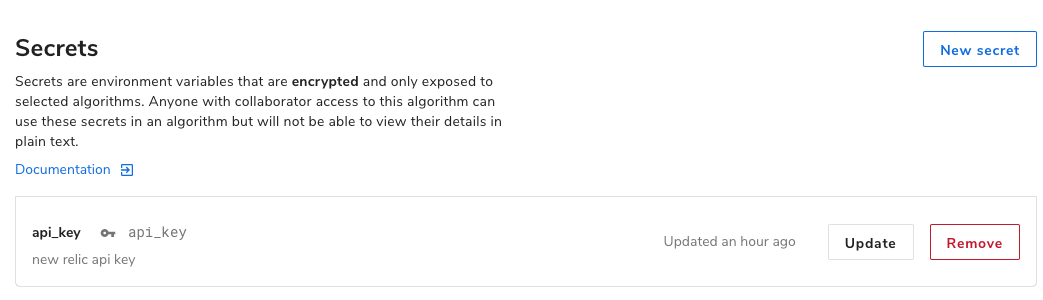
Go to algorithm Settings and add your New Relic API key to your algorithm’s Secret Store. For detailed instructions on how to use algorithm secrets, please see Secret Store.
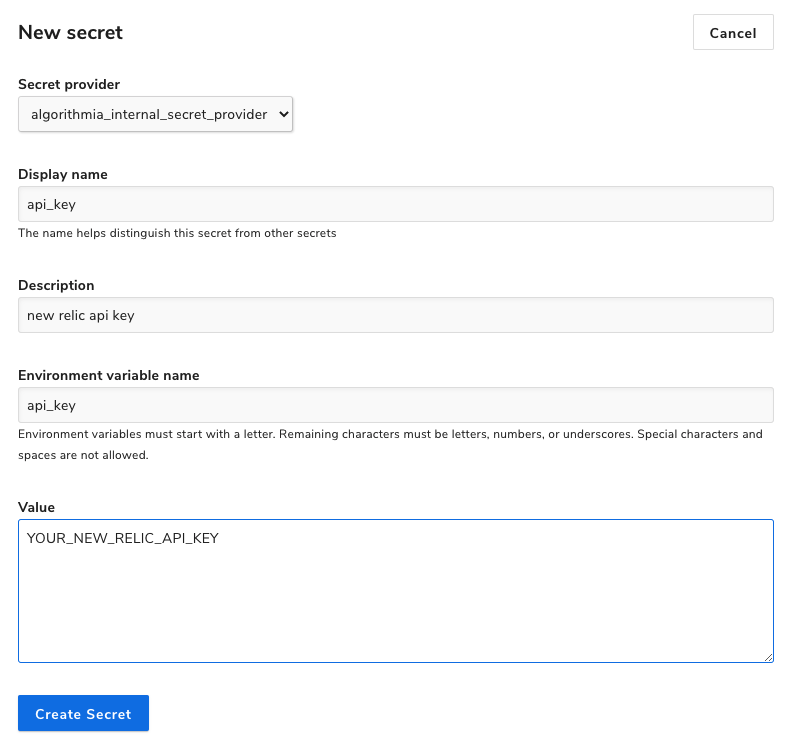
After creating the secret it’ll be displayed under the Settings tab on your algorithm’s homepage.
Build New Relic connector algorithm
Build your algorithm with the following source code and dependencies:
Source Code
import Algorithmia
import json
import os
import datetime
import dateutil.parser as dp
from newrelic_telemetry_sdk import GaugeMetric, MetricClient

client = Algorithmia.client()
newrelic_api_key = os.getenv("api_key")
metric_client = MetricClient(newrelic_api_key)

def convert_str_timestamp_to_epoch(str_time):
    parsed_t = dp.parse(str_time)
    return parsed_t.timestamp()

def get_operational_metrics(payload):
    ALGORITHM_TAGS = {
    "algorithm_version",
    "request_id",
    "time",
    "algorithm_name",
    "session_id",
    "algorithm_owner"
    }
    inference_metrics = {
        key: payload[key] for key in payload.keys() ^ ALGORITHM_TAGS
    }
    return inference_metrics

def send_to_newrelic(inference_metrics, insights_payload):
    newrelic_metrics = []
    for key, value in inference_metrics.items():
        name = "algorithmia." + key
        epoch_time = convert_str_timestamp_to_epoch(insights_payload["time"])
        tags = {
            "algorithm_name": insights_payload["algorithm_name"],
            "algorithm_version": insights_payload["algorithm_version"],
            "algorithm_owner": insights_payload["algorithm_owner"],
            "request_id": insights_payload["request_id"],
            "session_id": insights_payload["session_id"],
        }

        newrelic_metrics.append(GaugeMetric(
            name=name, value=value, tags=tags, end_time_ms=epoch_time
        ))

    response = metric_client.send_batch(newrelic_metrics)
    response.raise_for_status()

def apply(input):
    insights_payload = input
    inference_metrics = get_operational_metrics(insights_payload)
    send_to_newrelic(inference_metrics, insights_payload)
    return "200"
Dependencies
algorithmia>=1.0.0,<2.0
newrelic_telemetry_sdk==0.4.2
If you’re using the Web IDE to create these, click on Save and then Build to compile your algorithm. If you’re developing your algorithm locally, git push your algorithm repository as you’d normally do to build an algorithm version. Once your build finishes, you can test it with this sample payload and make sure it runs successfully. This test input is how your Insights payload will look.
{
  "risk_score": 0.2,
  "duration_milliseconds": 8,
  "algorithm_version": "1.0.6",
  "session_id": "rses-f28bb94a-5556-4aeb-a6d2-89493626bf4f",
  "time": "2021-02-20T00:21:54.867231",
  "algorithm_name": "credit_card_approval",
  "request_id": "req-9f5345b4-a1cd-431c-a43a-bd2a06f4a6f4",
  "algorithm_owner": "asli"
}
Configure Algorithmia Event Flows
Once your New Relic connector algorithm is published, configure it to get triggered whenever a Kafka topic receives a message. This Kafka topic will be the same as your Algorithmia Insights topic. This way, when an algorithm that has Insights enabled gets called and emits its metrics, the metrics payload will be used to call your New Relic connector algorithm. Detailed instructions on how to configure this event-based flow are in our Algorithmia Event Flows documentation.
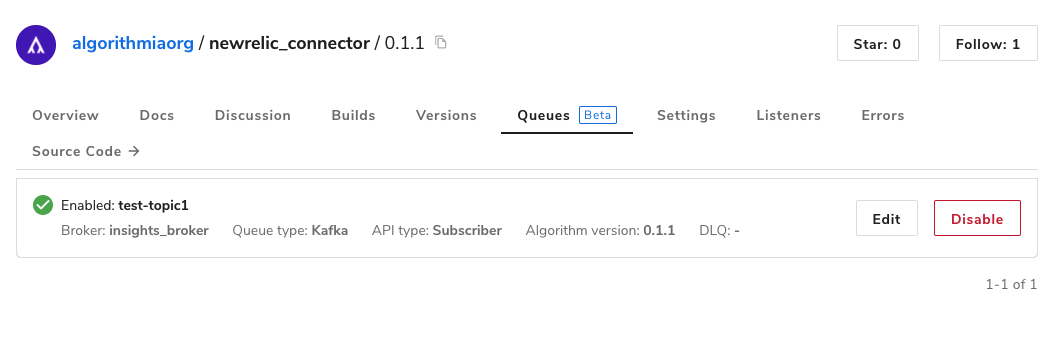
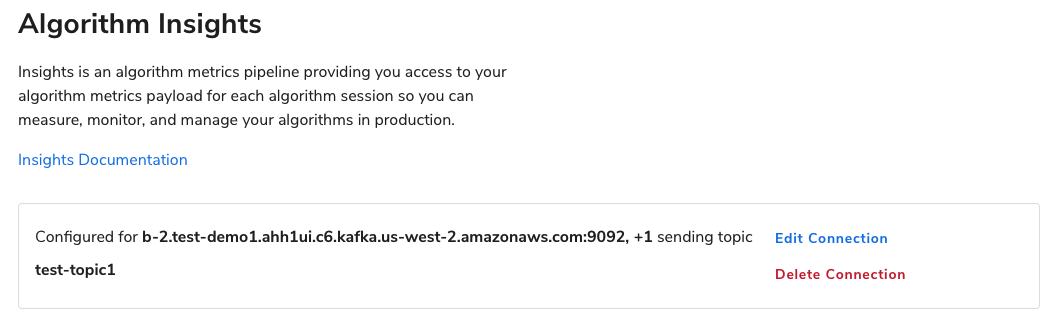
Below is an example of how the complete configuration will look once Algorithmia Insights and the New Relic connector algorithm are configured for the same Kafka topic.
On the Insights page, the designated Kafka broker topic will be configured to receive Insights.
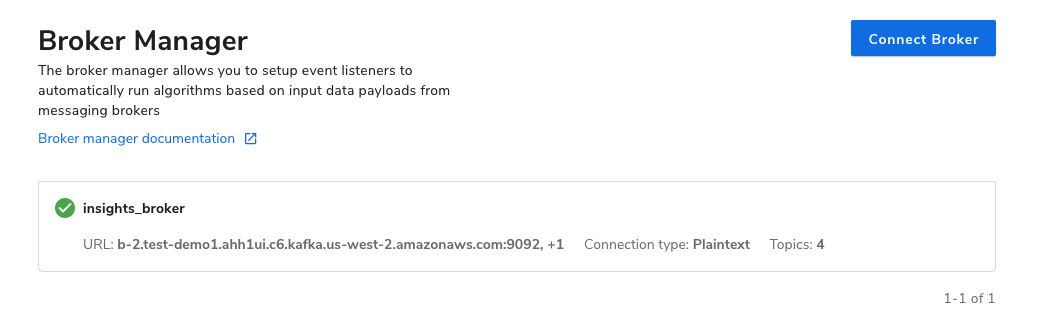
The same Kafka broker will be configured in the Broker Manager panel.
The New Relic connector algorithm will be added as a Subscriber for the same topic used for Insights.
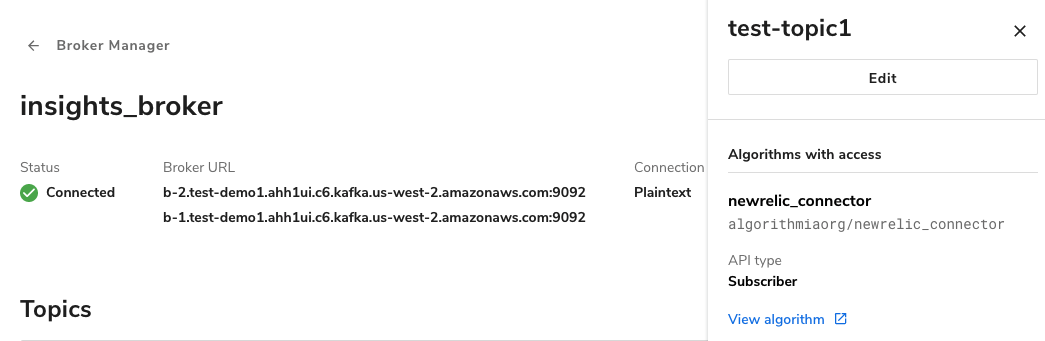
The specific version of the New Relic algorithm will be enabled to consume from this topic.