 InfluxDB
This feature is available to Algorithmia Enterprise users only.
In this tutorial, learn how you can monitor your model performance metrics with InfluxDB and Telegraf using the new Insights feature of Algorithmia Enterprise.
Algorithmia Insights is a new feature of Algorithmia Enterprise and provides a metrics pipeline that can be used to instrument, measure, and monitor your machine learning models. Monitoring your model performance metrics can help with your organization’s overall AI/ML governance efforts, and use cases include detecting model drift, data drift, and model bias.
InfluxDB is an open-source time-series platform that stores and queries data for monitoring and alerting purposes, dashboards, visualizing and exploring data, and more. Telegraf is an agent that collects, processes, aggregates, and writes metrics to and from various systems. You can use Telegraf to collect real-time model performance metrics from Algorithmia and store them as as time-series data in InfluxDB that can be included in dashboards and alerts.
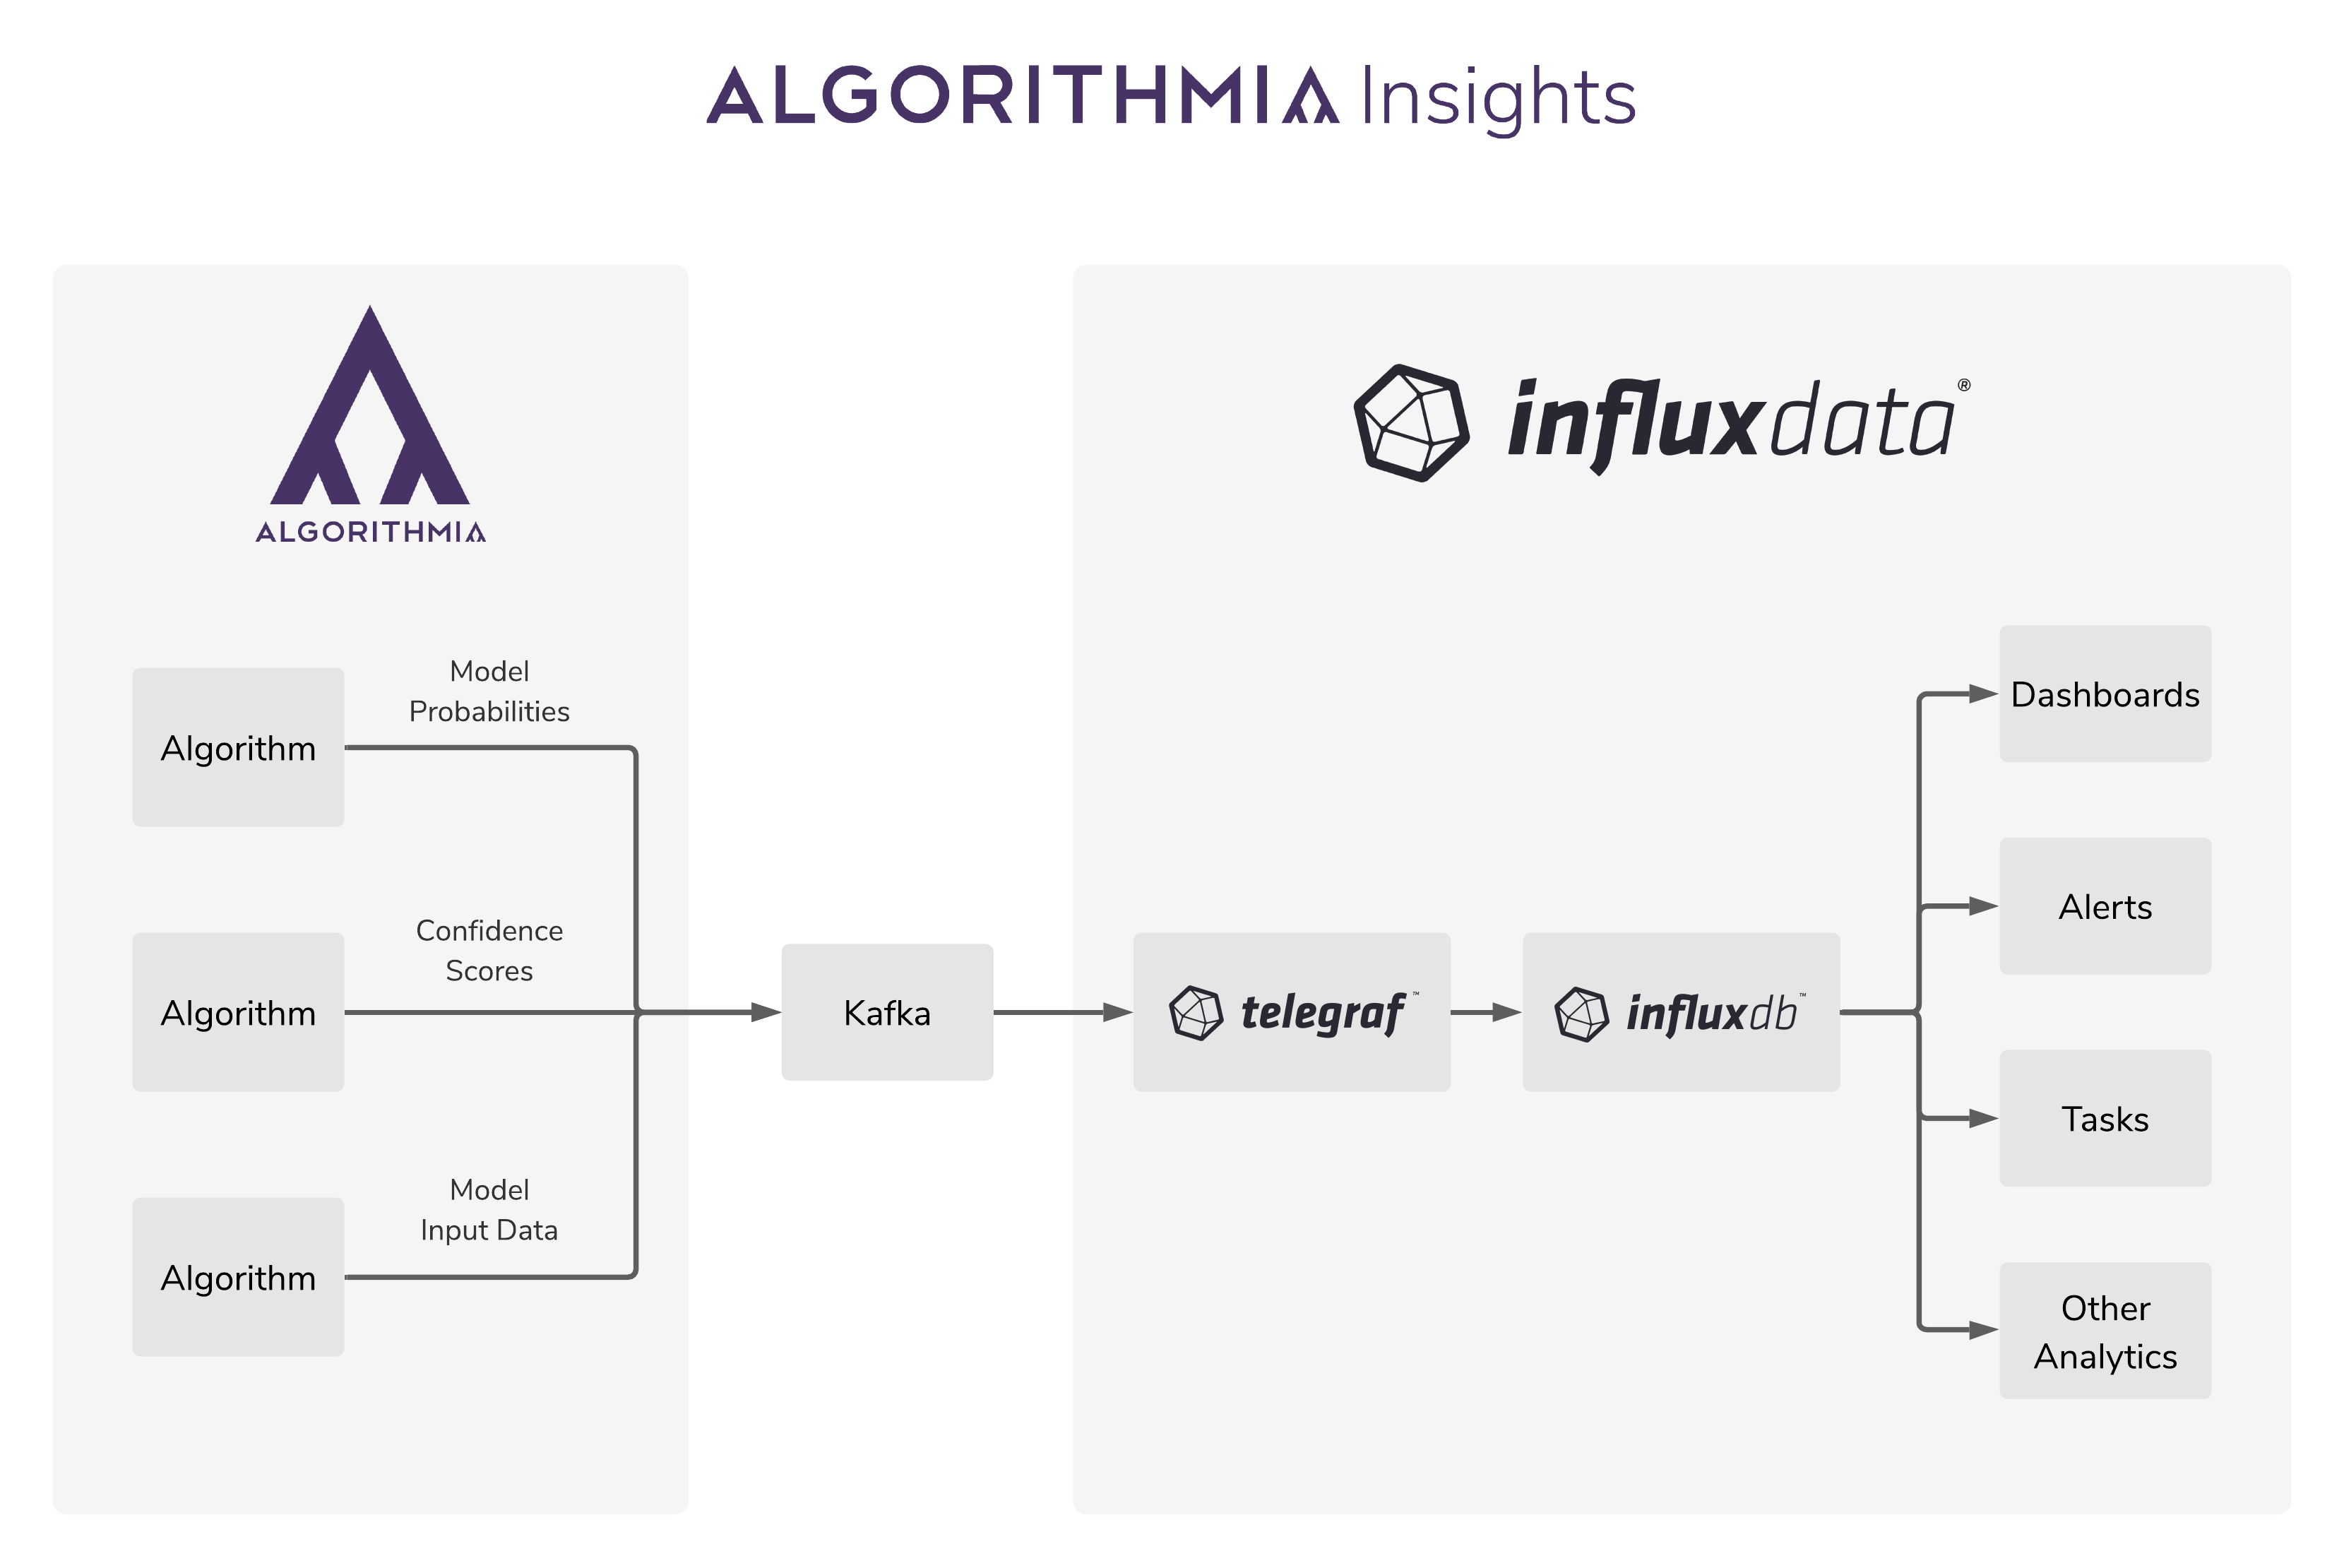
The Algorithmia-InfluxDB integration described in this post allows you to stream operational and inference metrics from your models in Algorithmia to InfluxDB, where you can create dashboards and alerts to analyze model performance metrics in production systems across your entire model catalog.
How the Algorithmia-InfluxDB integration works
When algorithms that have Insights enabled are queried, Algorithmia emits a metrics payload to a configured Kafka broker and topic. One of the methods you can use to move data from Kafka into InfluxDB involves using Telegraf along with the Kafka consumer input plugin.
You can follow the steps documented in the Algorithmia-InfluxDB integration to configure Telegraf to consume Insights data from Kafka and send it to InfluxDB. All of the data from Algorithmia Insights will show up in InfluxDB as metrics from the measurement input named algorithmia. This makes it easy to include model performance data from Algorithmia Insights in dashboards or alerts.
The integration template includes all of the necessary configuration for Telegraf, an InfluxDB bucket to store Insights data, and a sample dashboard in InfluxDB. This integration makes use of the newer version of InfluxDB 2.0, which includes a time-series database, UI and dashboarding tools, and a background processing and monitoring agent in a single tool.
The metrics payload from Algorithmia Insights contains both operational and inference metrics. Operational metrics include the algorithm name, version, owner, duration, session ID, and request ID. Inference metrics include user-defined metrics that are specified by data scientists depending on the particular algorithm and use case.
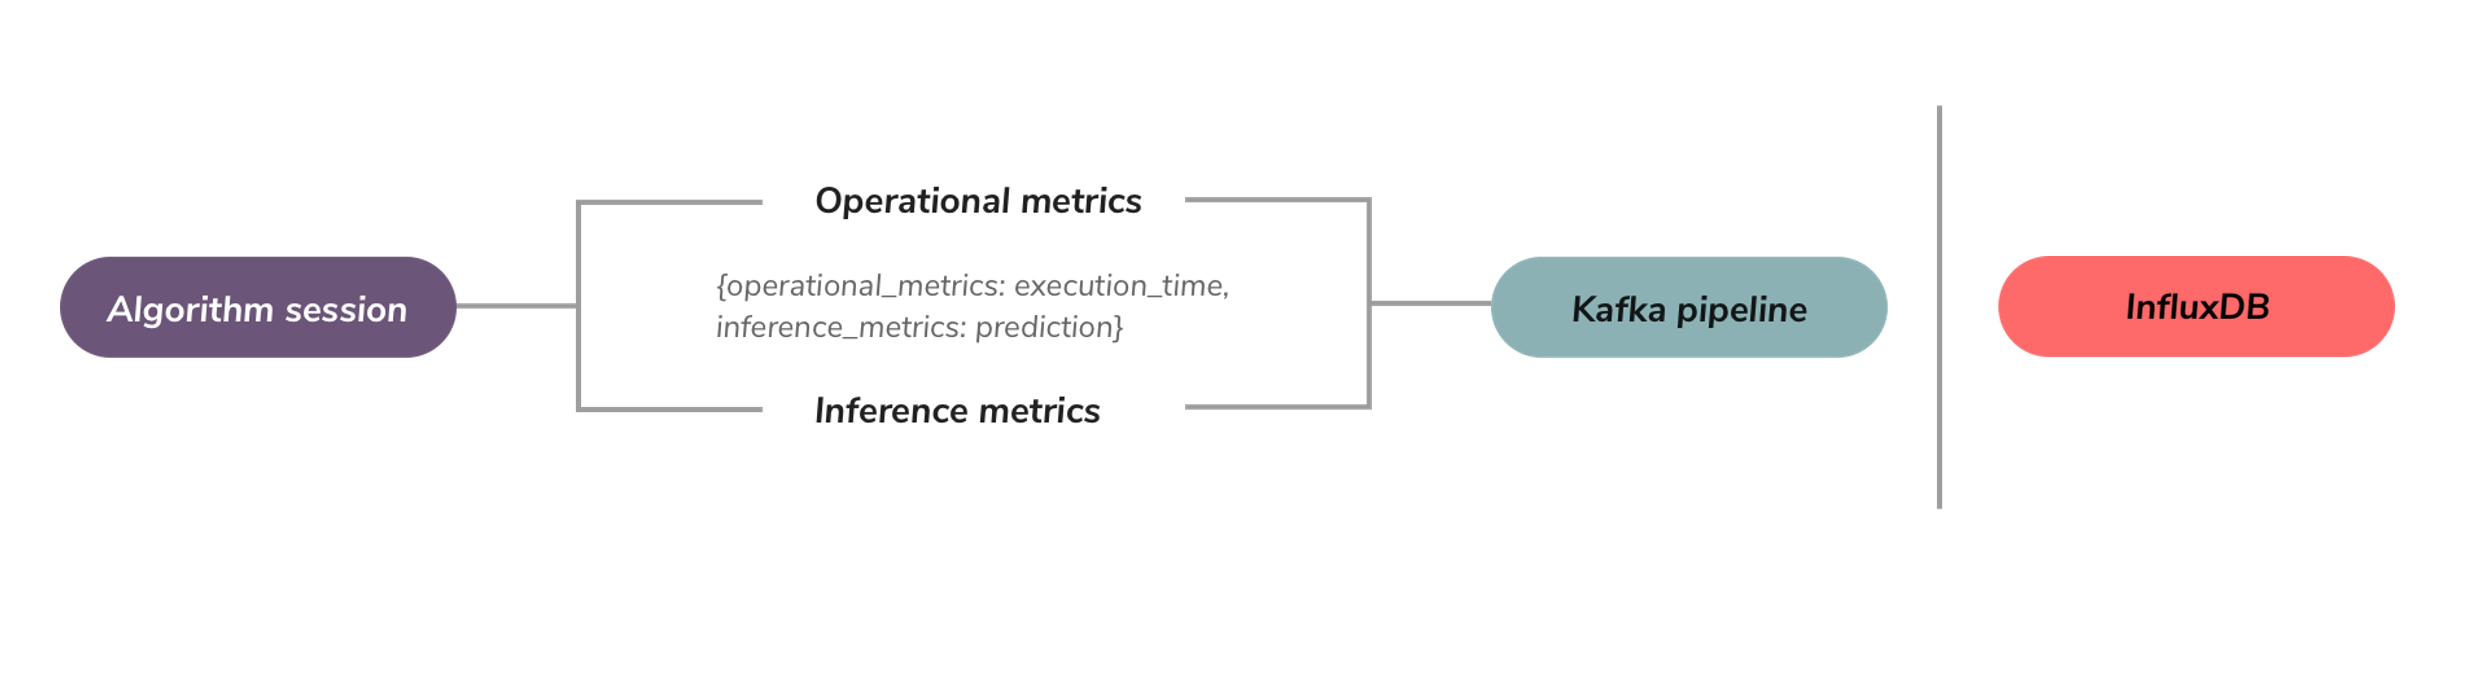
When this integration is used, the operational metrics related to the algorithm name, version, and owner will be included with each data point as tags in InfluxDB. These tags can then be used to filter and group model performance metrics in dashboards and alerts.
The steps to install and configure this integration can be summarized as:
- Configure Algorithmia to send Insights to a Kafka broker and topic
- Follow the steps documented in the Algorithmia-InfluxDB integration to install the InfluxDB template and start Telegraf with your InfluxDB host/token/organization and your Kafka broker/topic
- For any published algorithm on your cluster that has Insights enabled, once the algorithm’s API is called, those metrics will be pushed to DataDog.
- Verify that your metrics appear in InfluxDB under the measurement input named algorithmia
Example: Creating a dashboard with model performance metrics
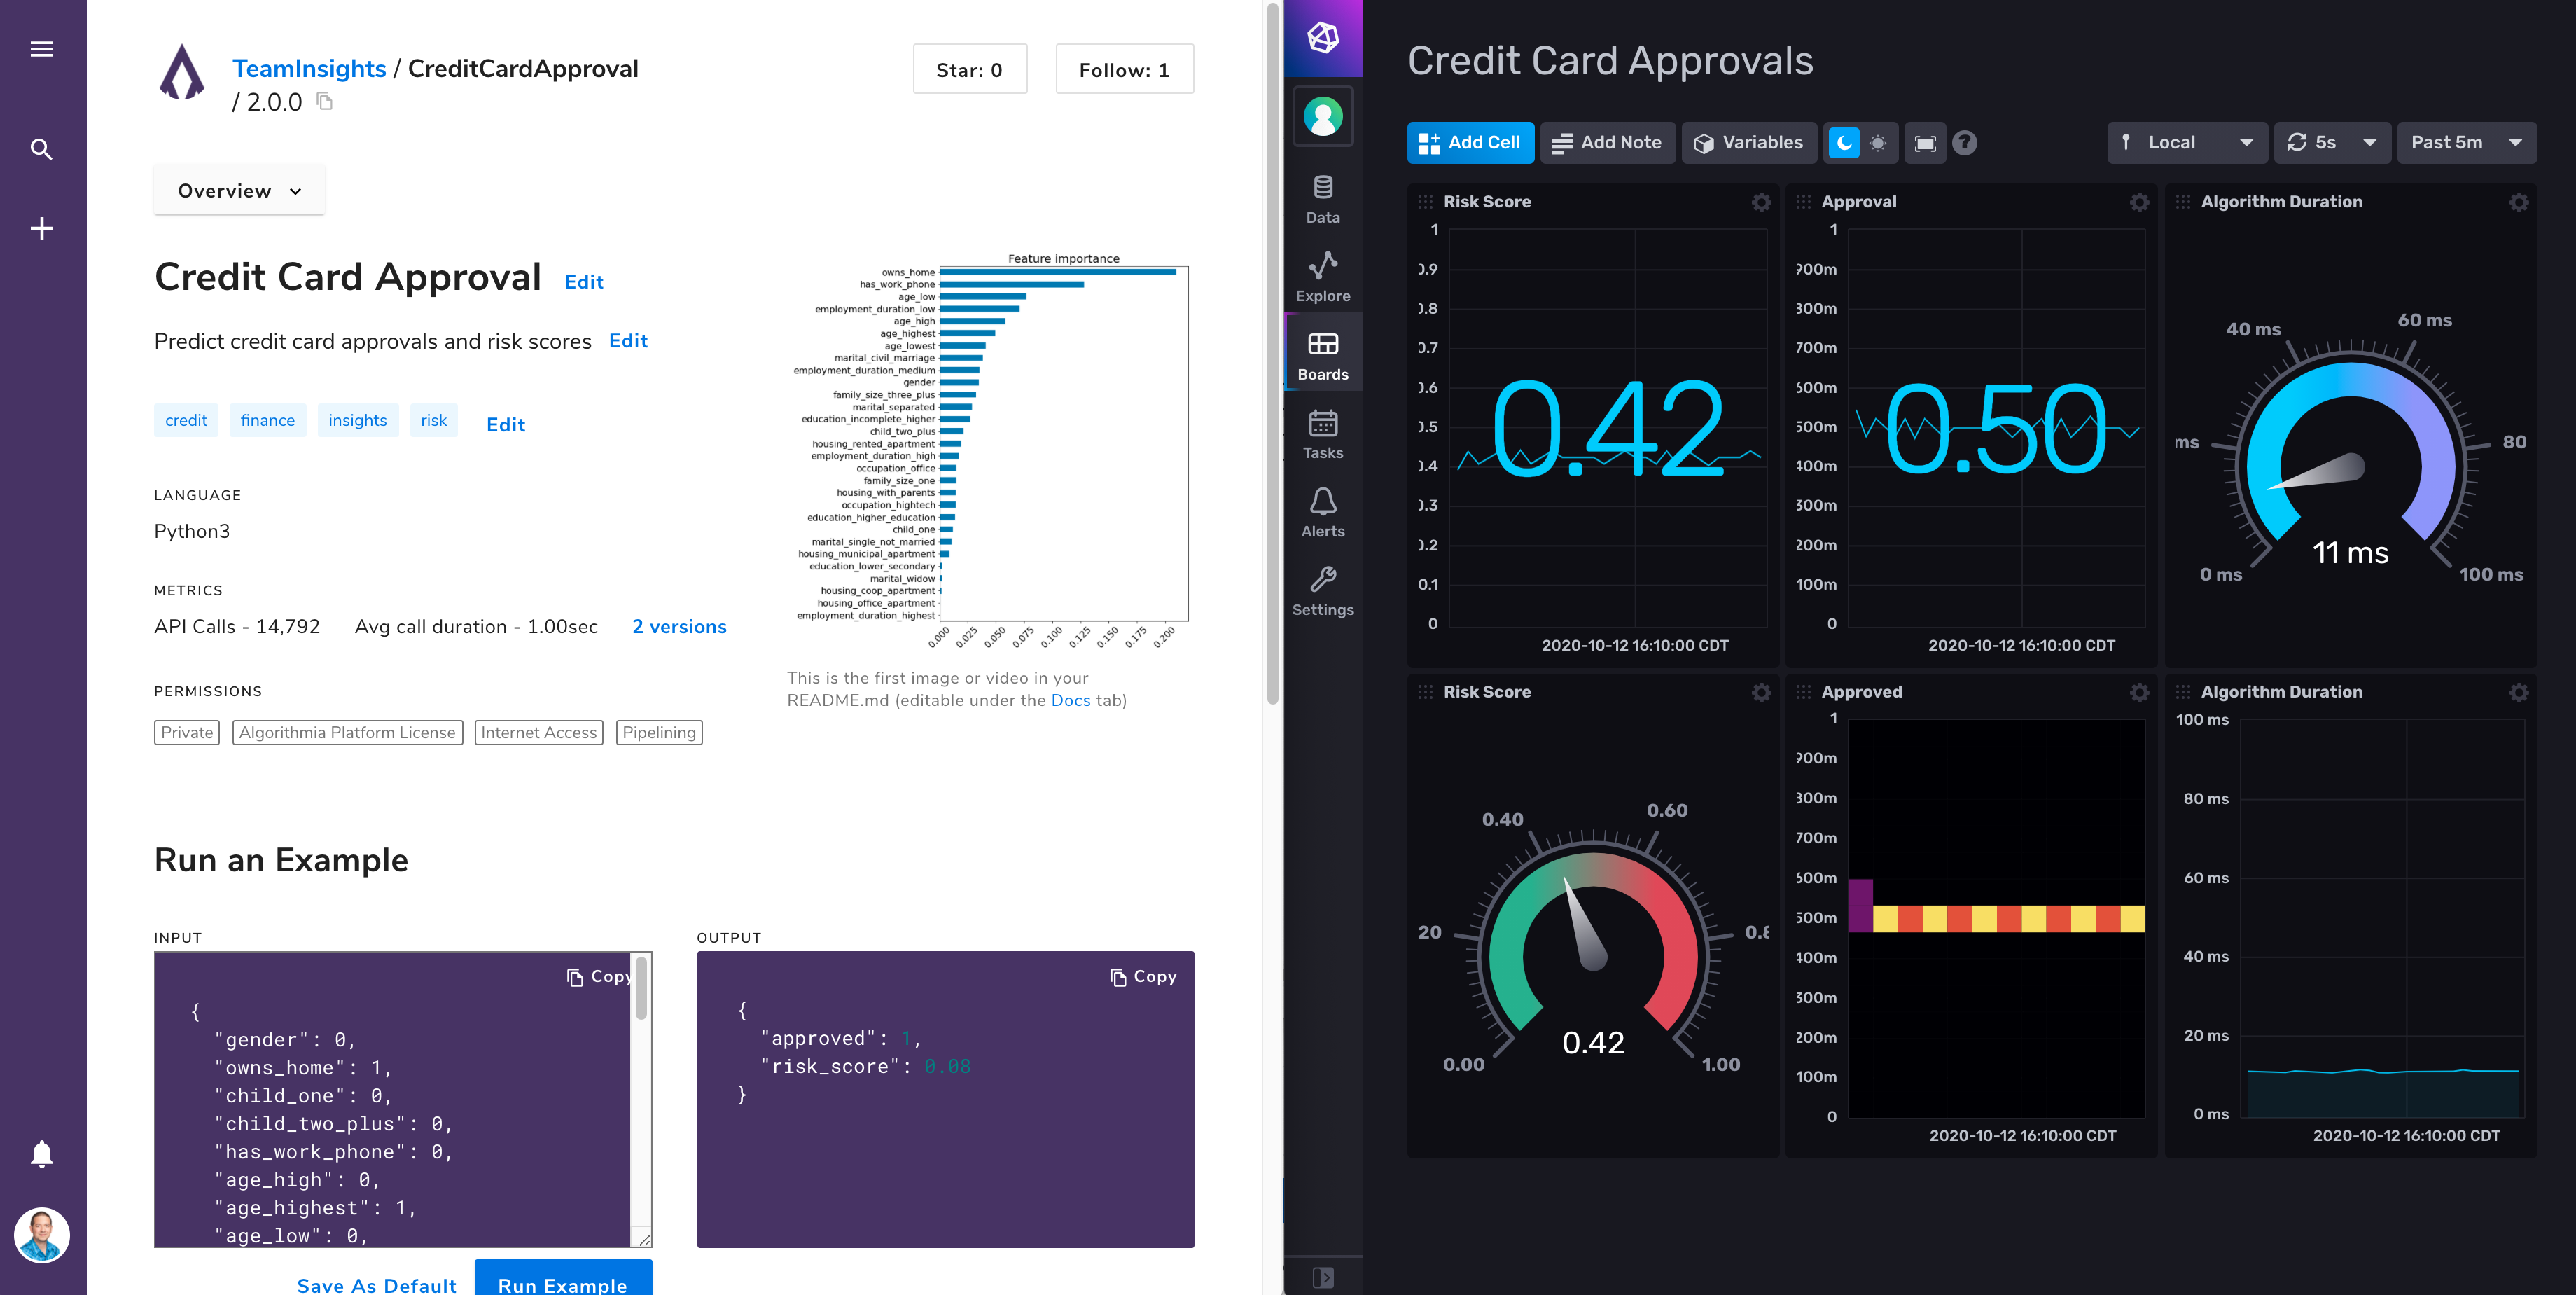
InfluxDB time-series data can be queried and graphed in dashboards, which includes visualization types such as line graphs, gauges, tables and more. You can use these dashboards to monitor the performance of your models in real-time.
In this example, we’ll walk through the steps to create a new dashboard in InfluxDB and visualize metrics from Algorithmia Insights.
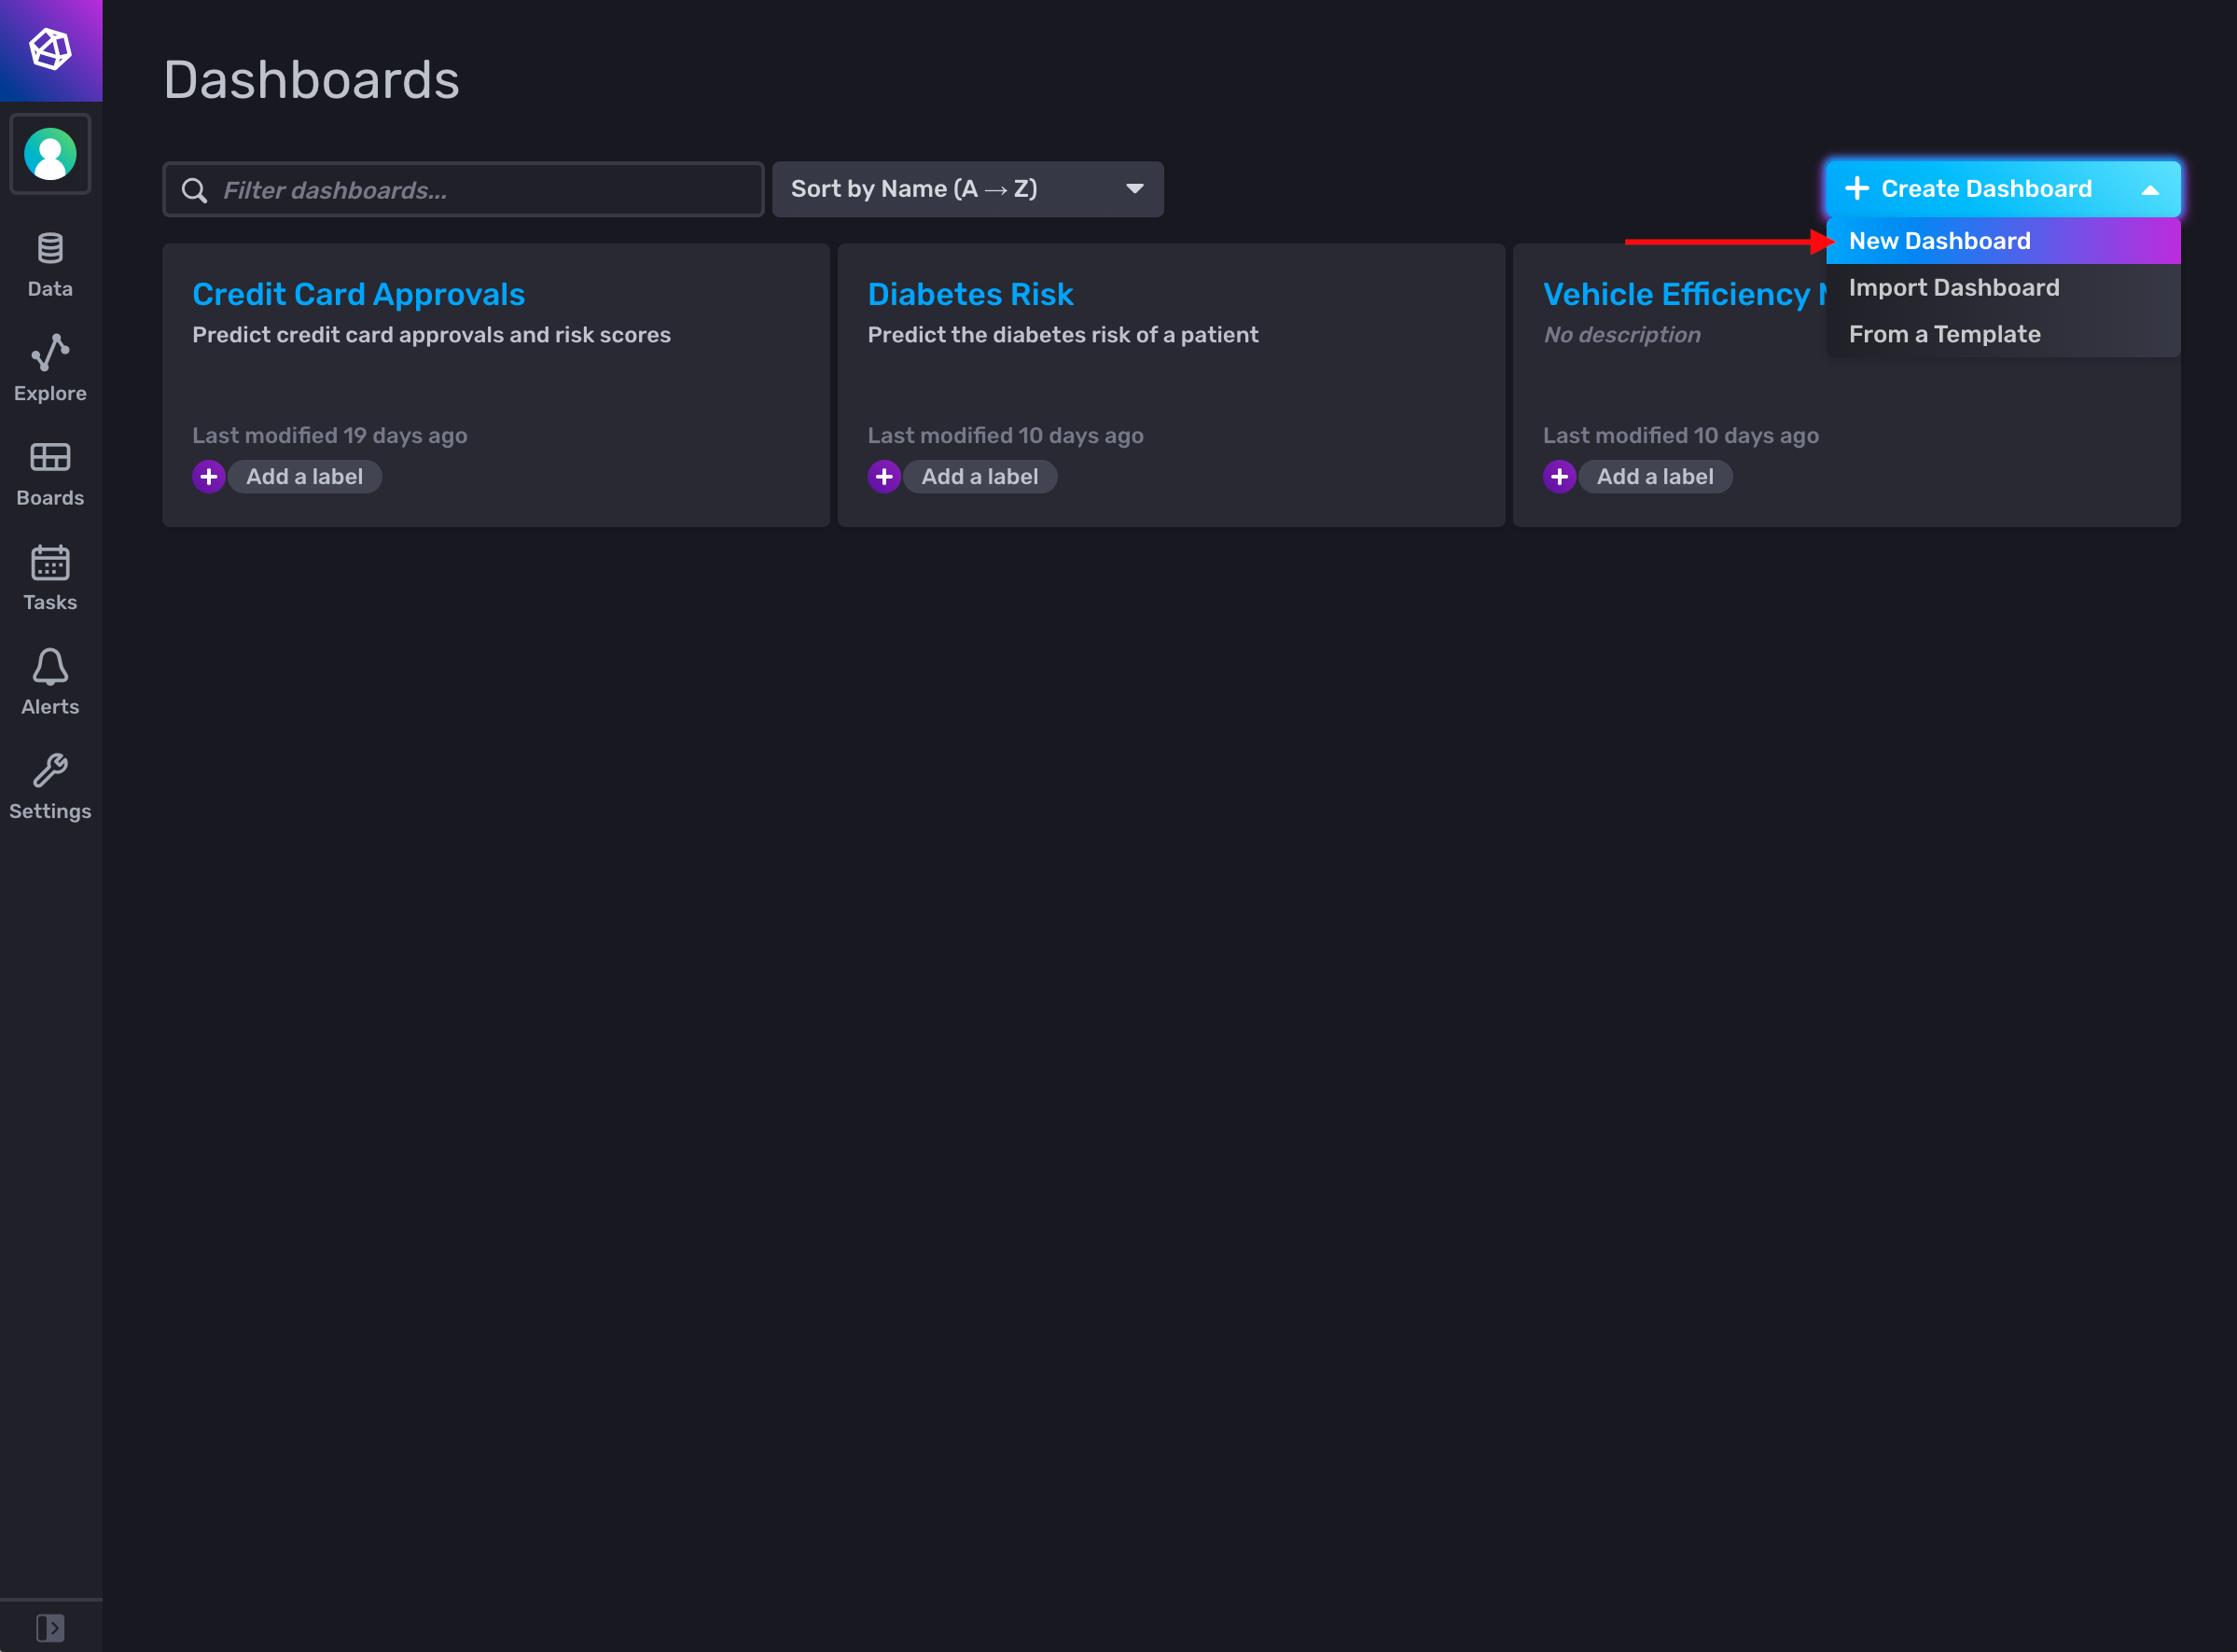
From the Boards page in InfluxDB, click on the Create Dashboard button, then select the option for New Dashboard:
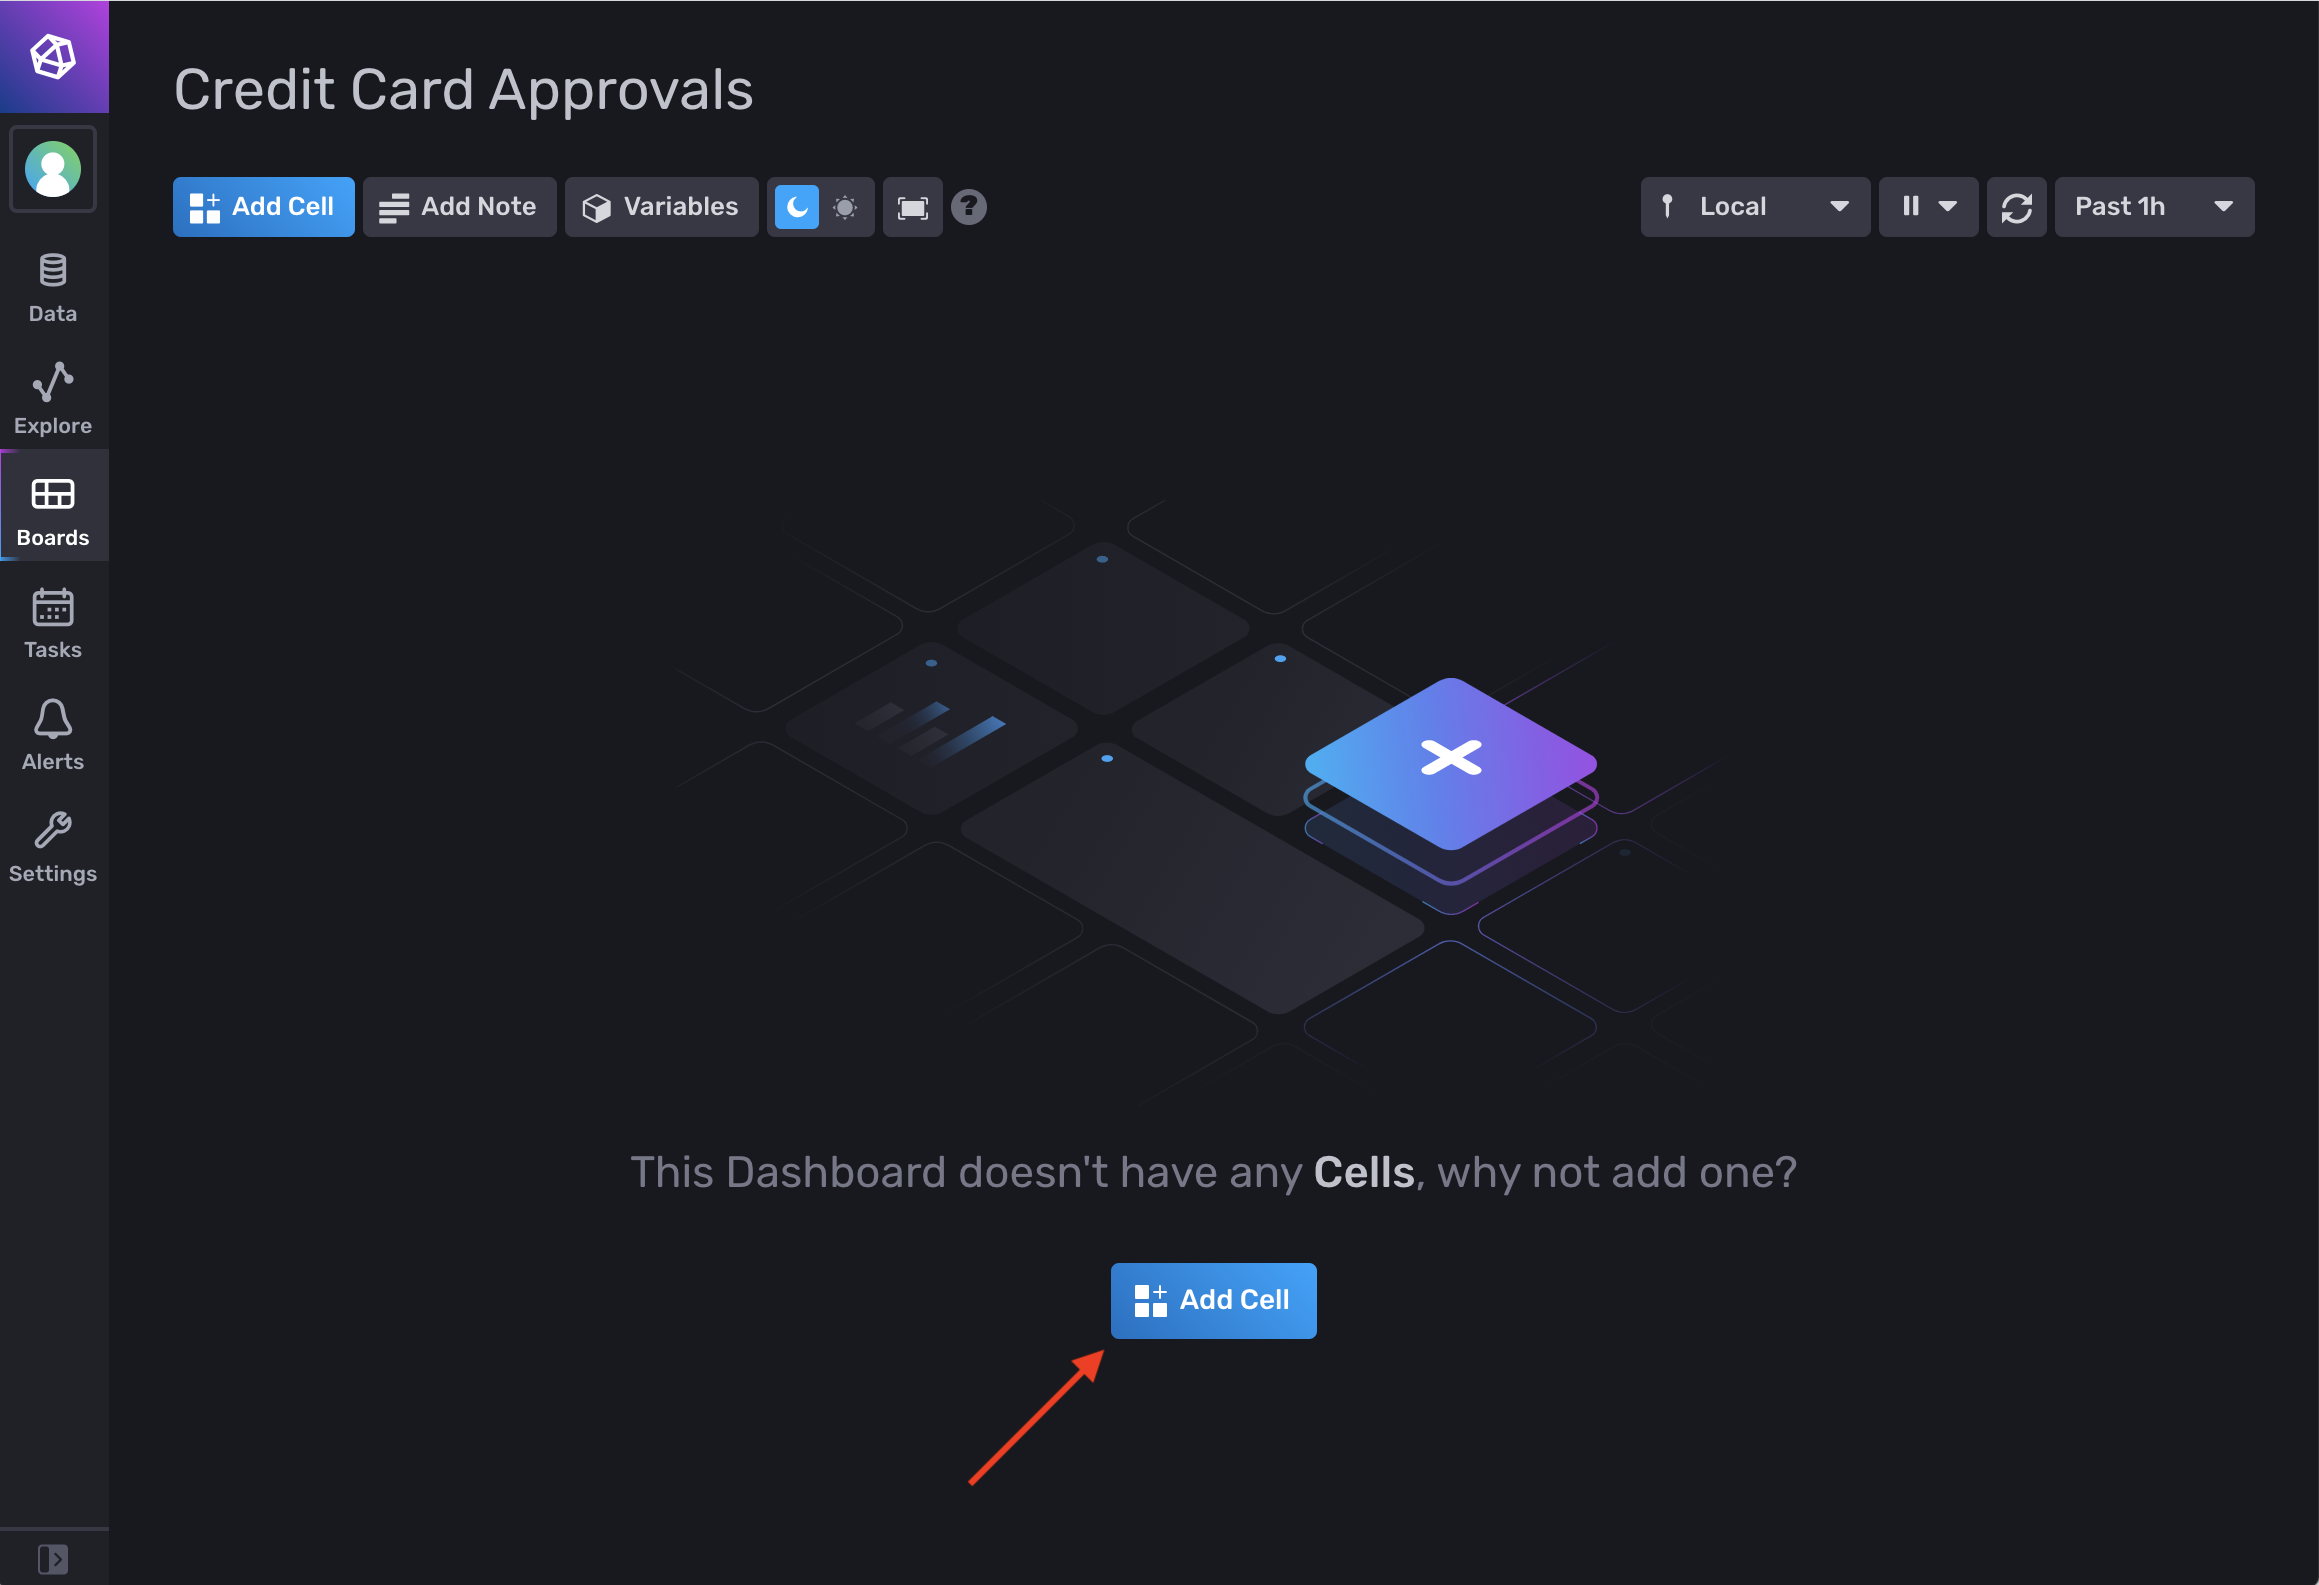
Give your new dashboard a name, then click on the Add Cell button:
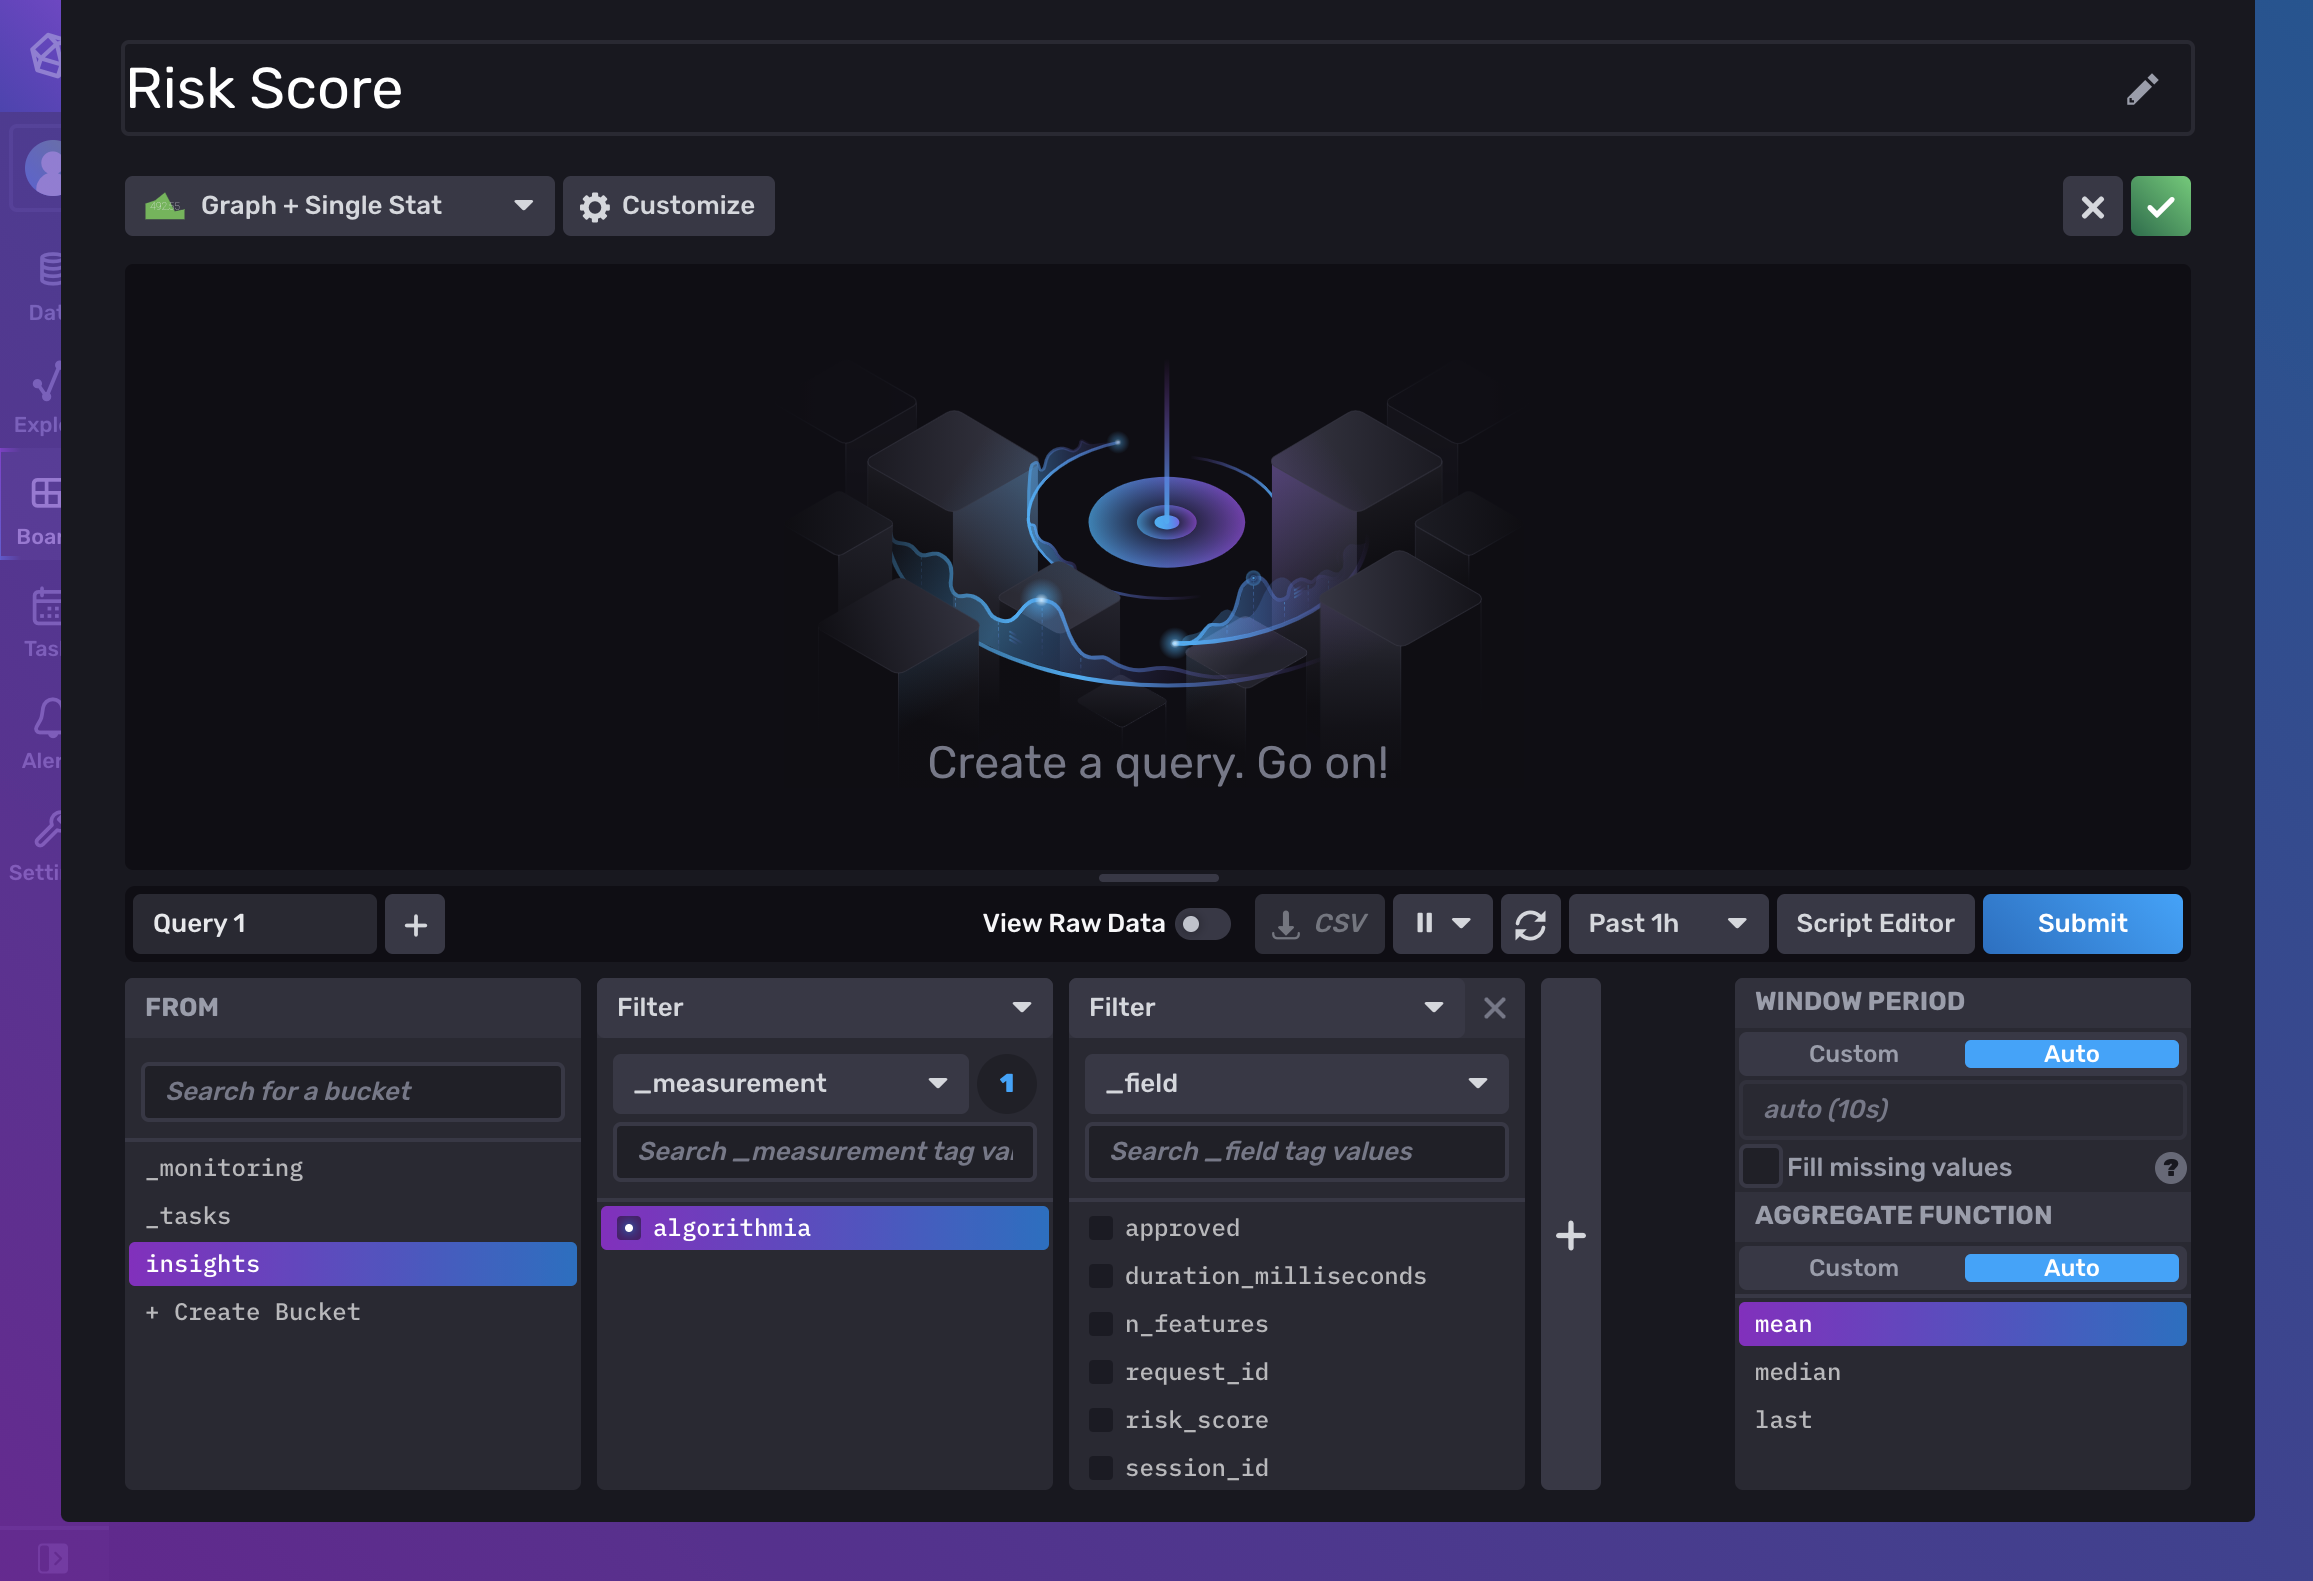
Give your new dashboard cell a name. On the top left of the dashboard, set the visualization type to Graph + Single Stat. In the From column, select the name of the bucket where you configured Insights data to get saved to (in this example, our bucket is named insights). In the next Filter column, select algorithmia as the measurement name:
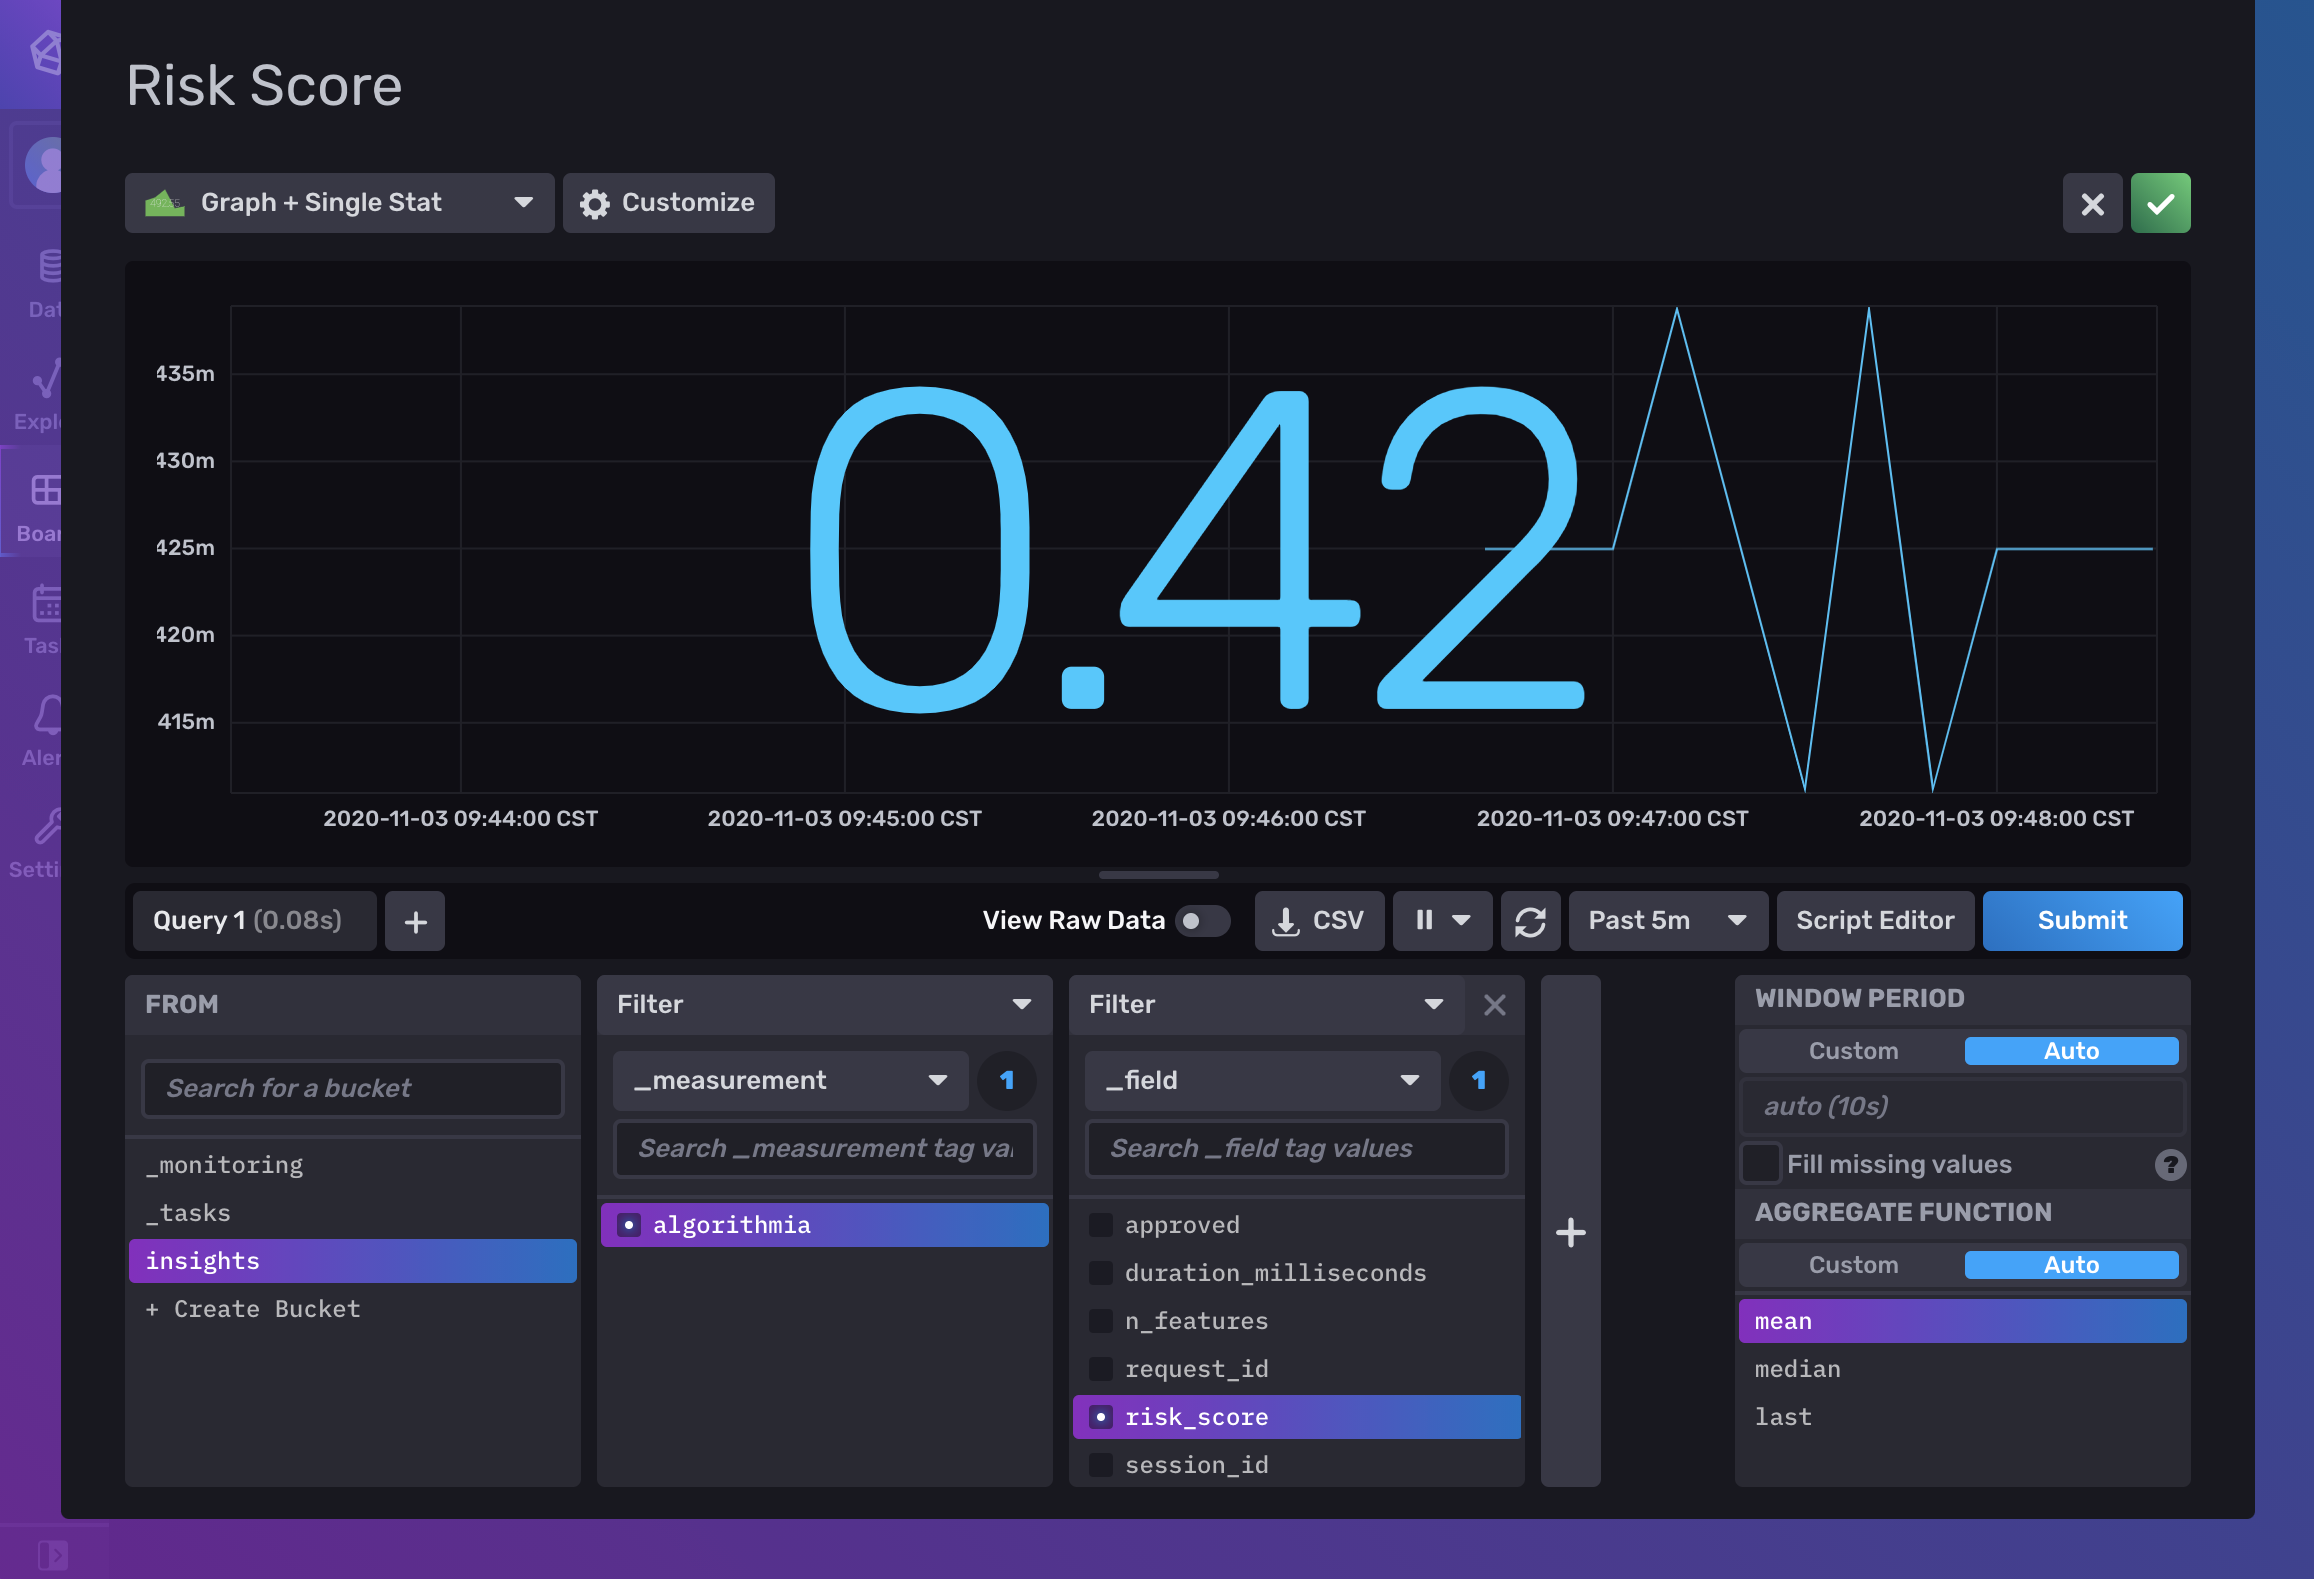
In the next Filter column, select the metric that you want to display from the list of metrics that appear. For example, we’ll choose the custom risk_score metric that we defined in a model (or you could choose the default operational metric named duration_milliseconds). Click on the Submit button to see a preview of your query in the visualization:
On the top right of the dashboard, click on the green checkmark to save the cell and return to the dashboard view:
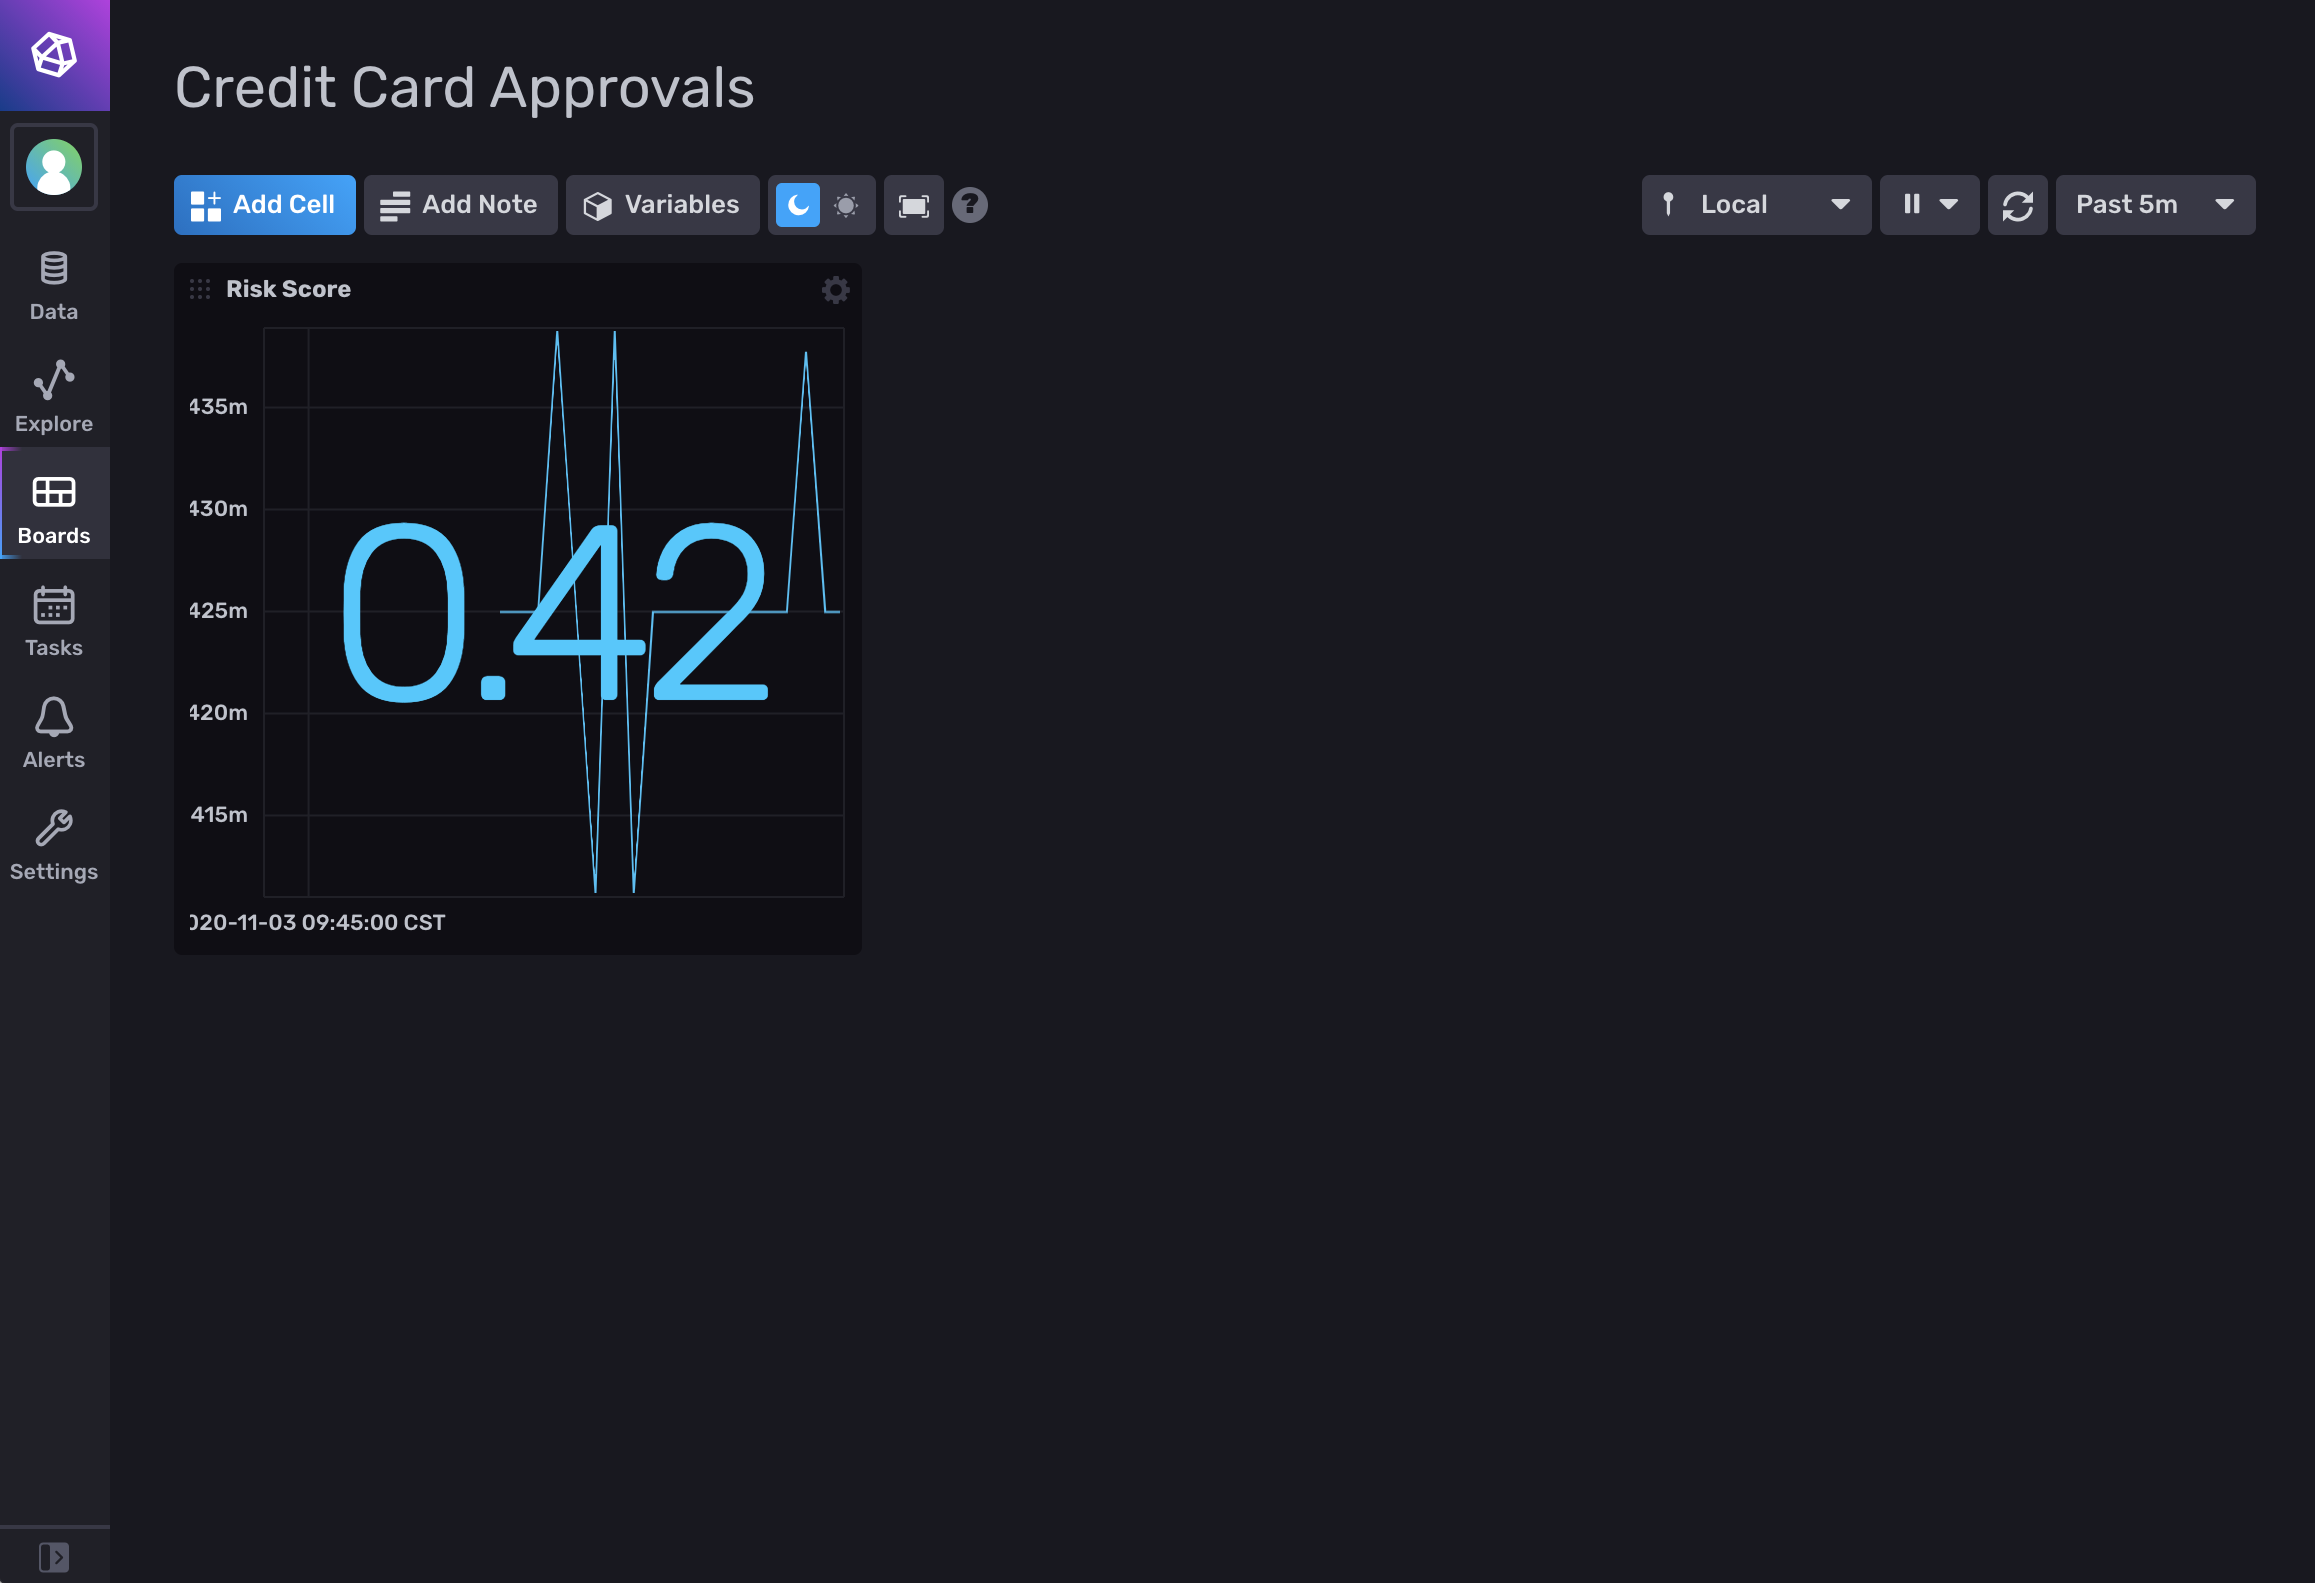
You can continue adding different widgets and customizing your dashboard to display different metrics from Insights:
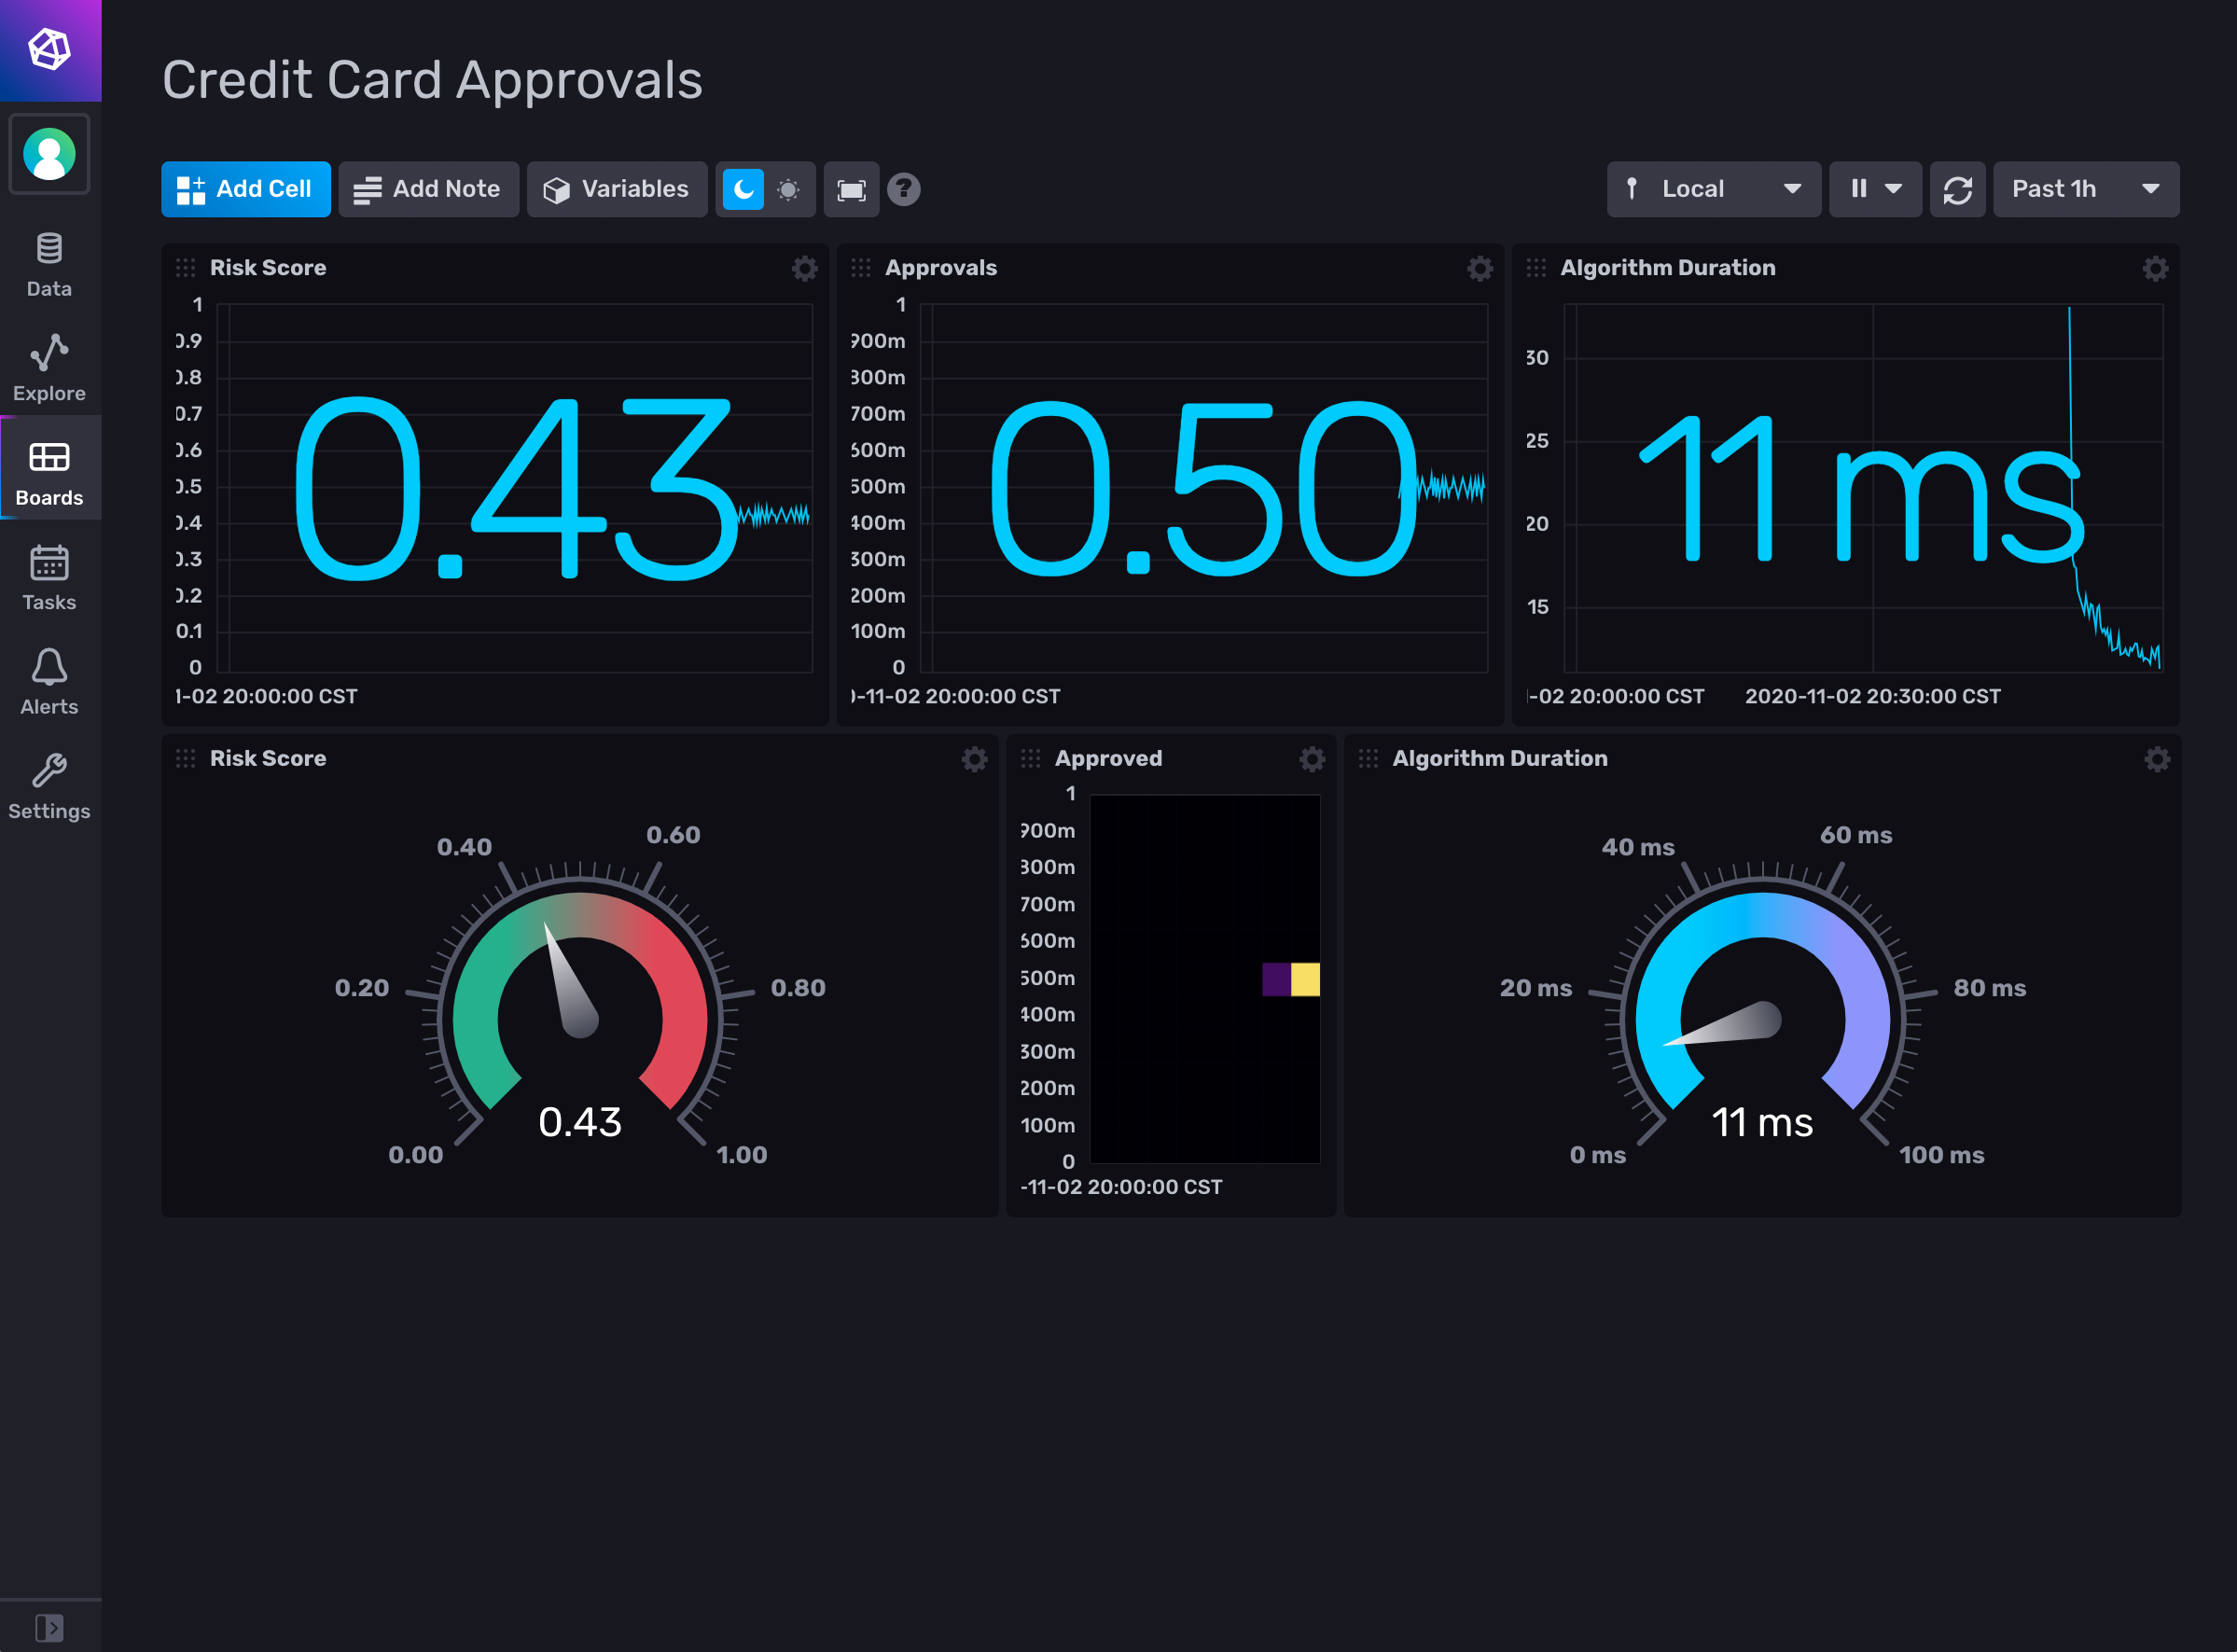
Now you’ll have all of the relevant model metrics from Insights displayed in one place on your dashboard with real-time updates as models are queried in Algorithmia.
Example: Creating an alert check for model performance metrics
InfluxDB enables you to monitor time-series data and send alerts by creating checks, notification rules, and notification endpoints.
In this example, we’ll walk through the steps to create a new alert in InfluxDB that monitors metrics from Algorithmia Insights.
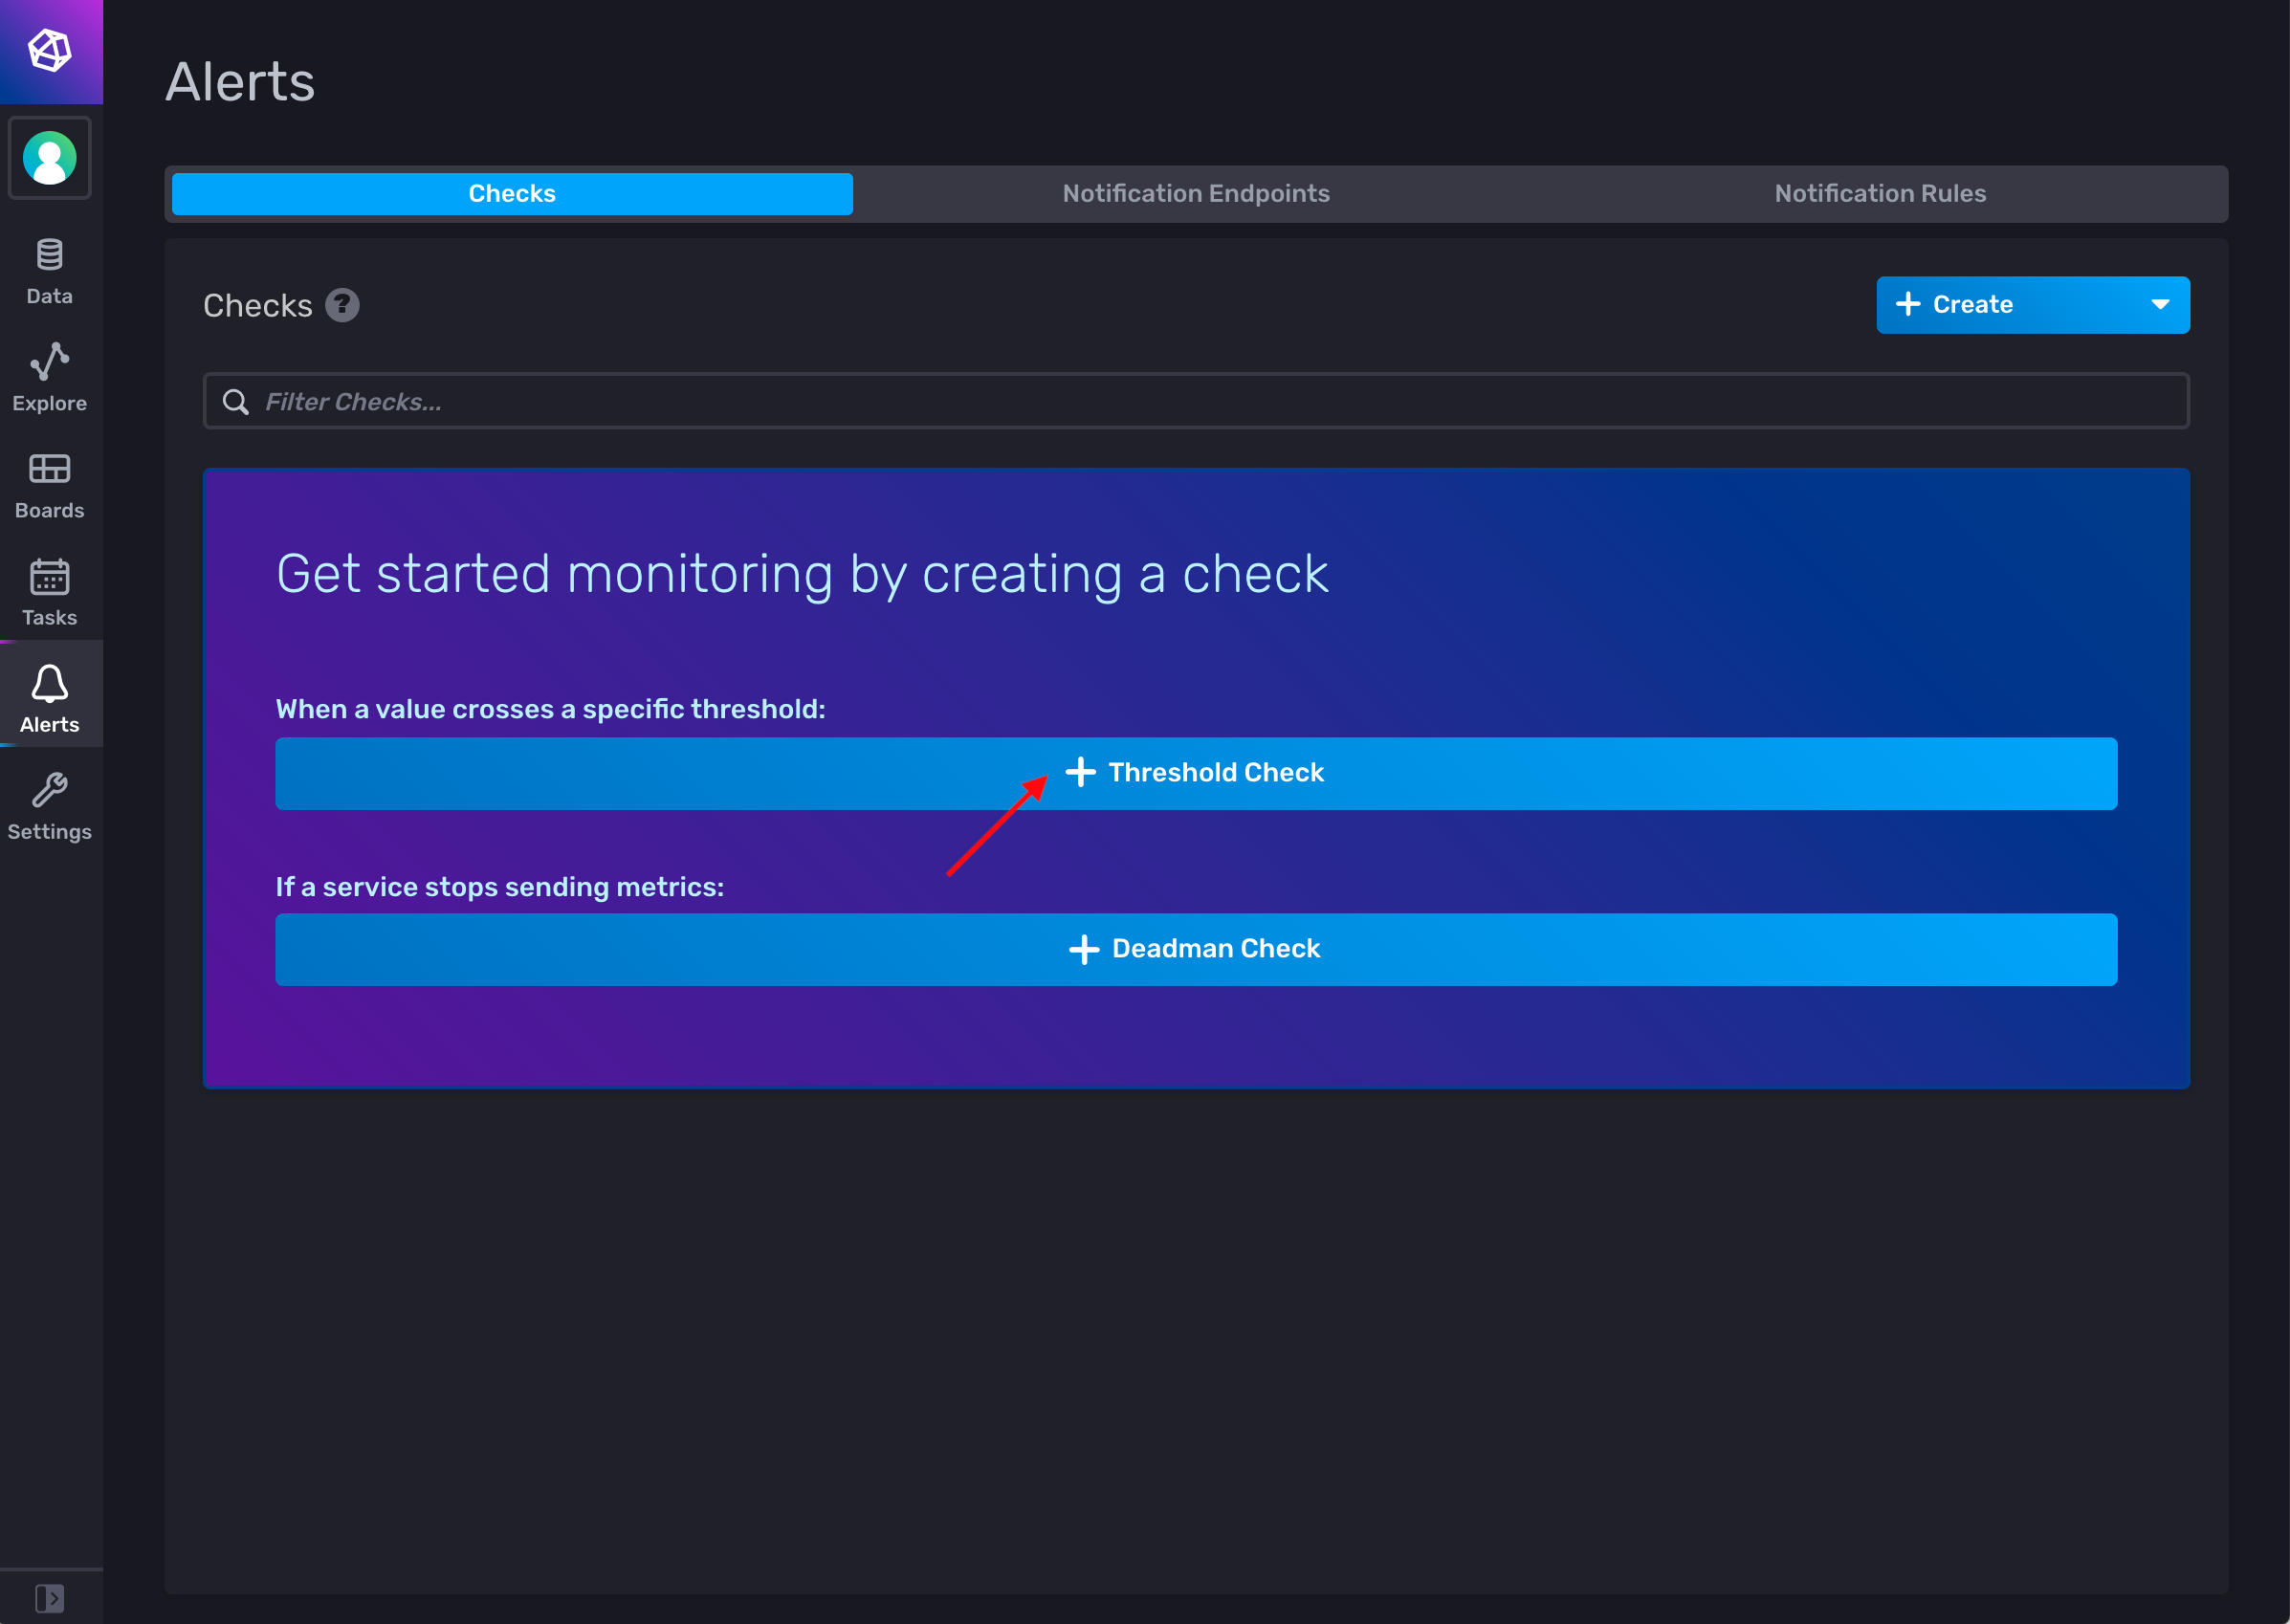
From the Alerts page in InfluxDB, click on the + Threshold Check button:
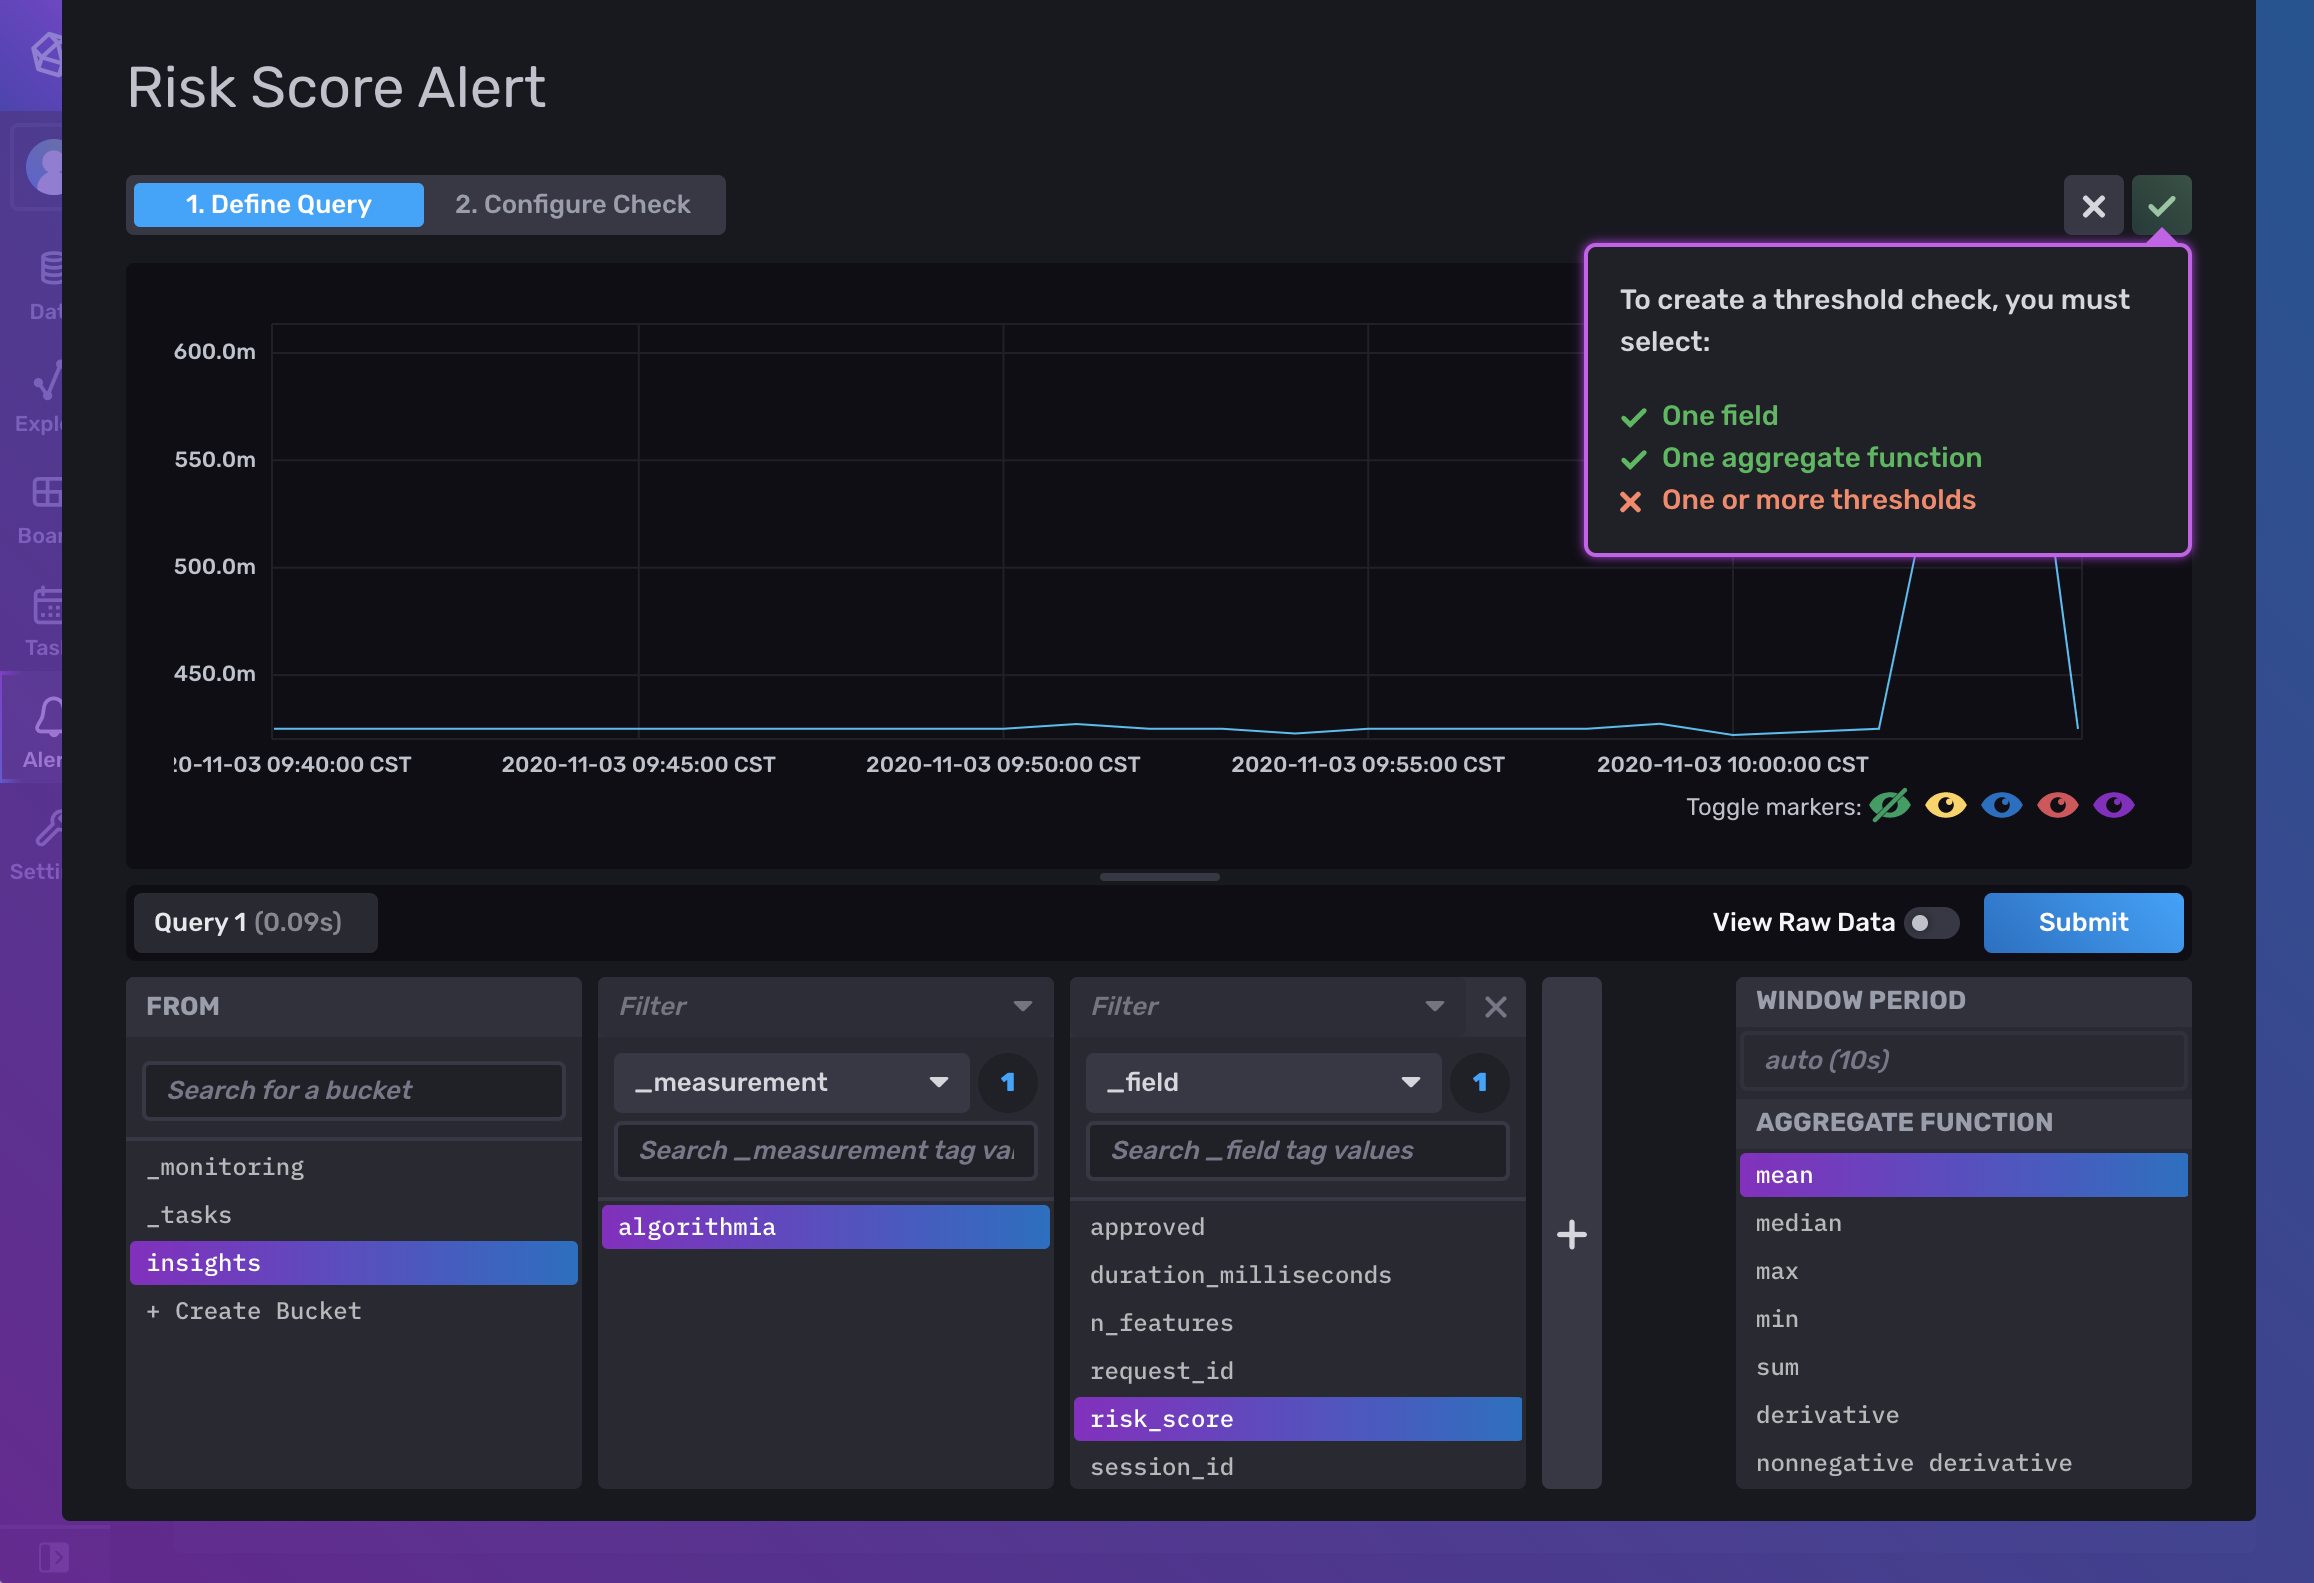
Specify a name for your new check. In the From column, select the bucket that contains Insights data (in our example, the bucket is named insights). In the next Filter column, select algorithmia as the measurement name:
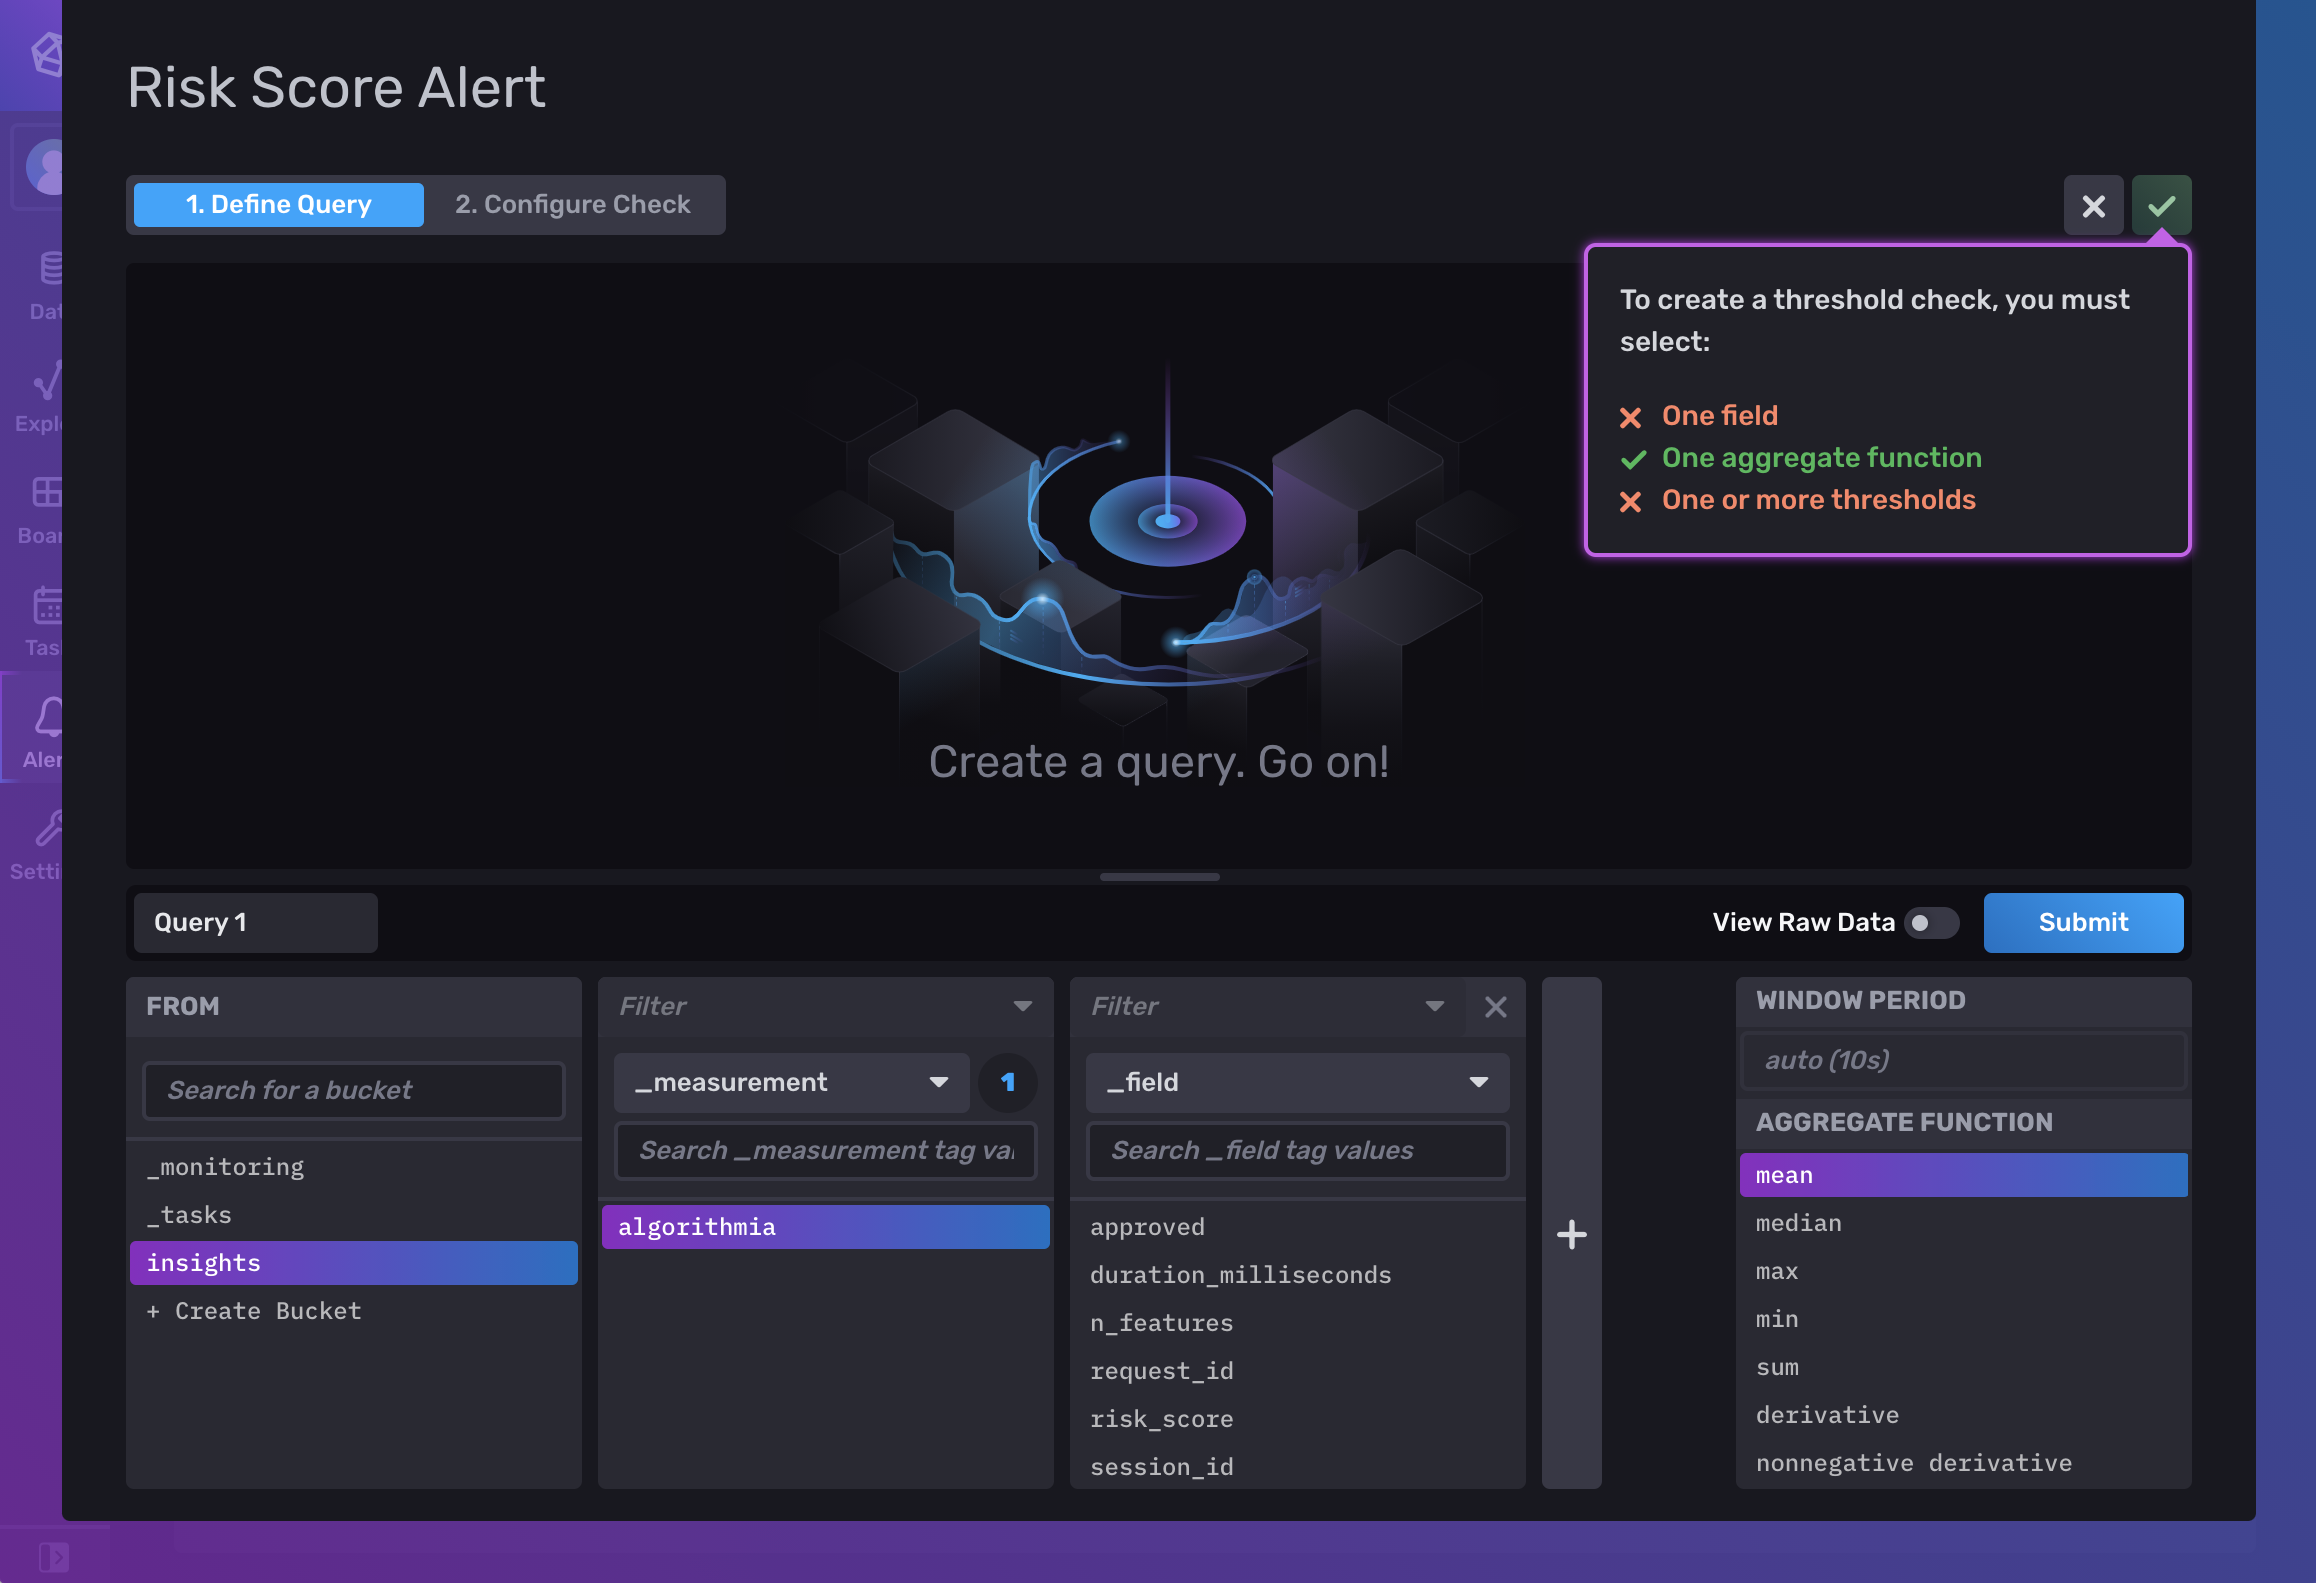
In the next Filter column, select the metric that you want to display from the list of metrics that appear. For example, we’ll choose the custom risk_score metric that we defined in a model (or you could choose the default operational metric named duration_milliseconds). Click on the Submit button to see a preview of your query in the visualization:
Click on the Configure Check tab near the top of the screen. In the Thresholds column, click on the + CRIT button, then define a value for the critical threshold (in this example, we’ll set the threshold to 0.70):
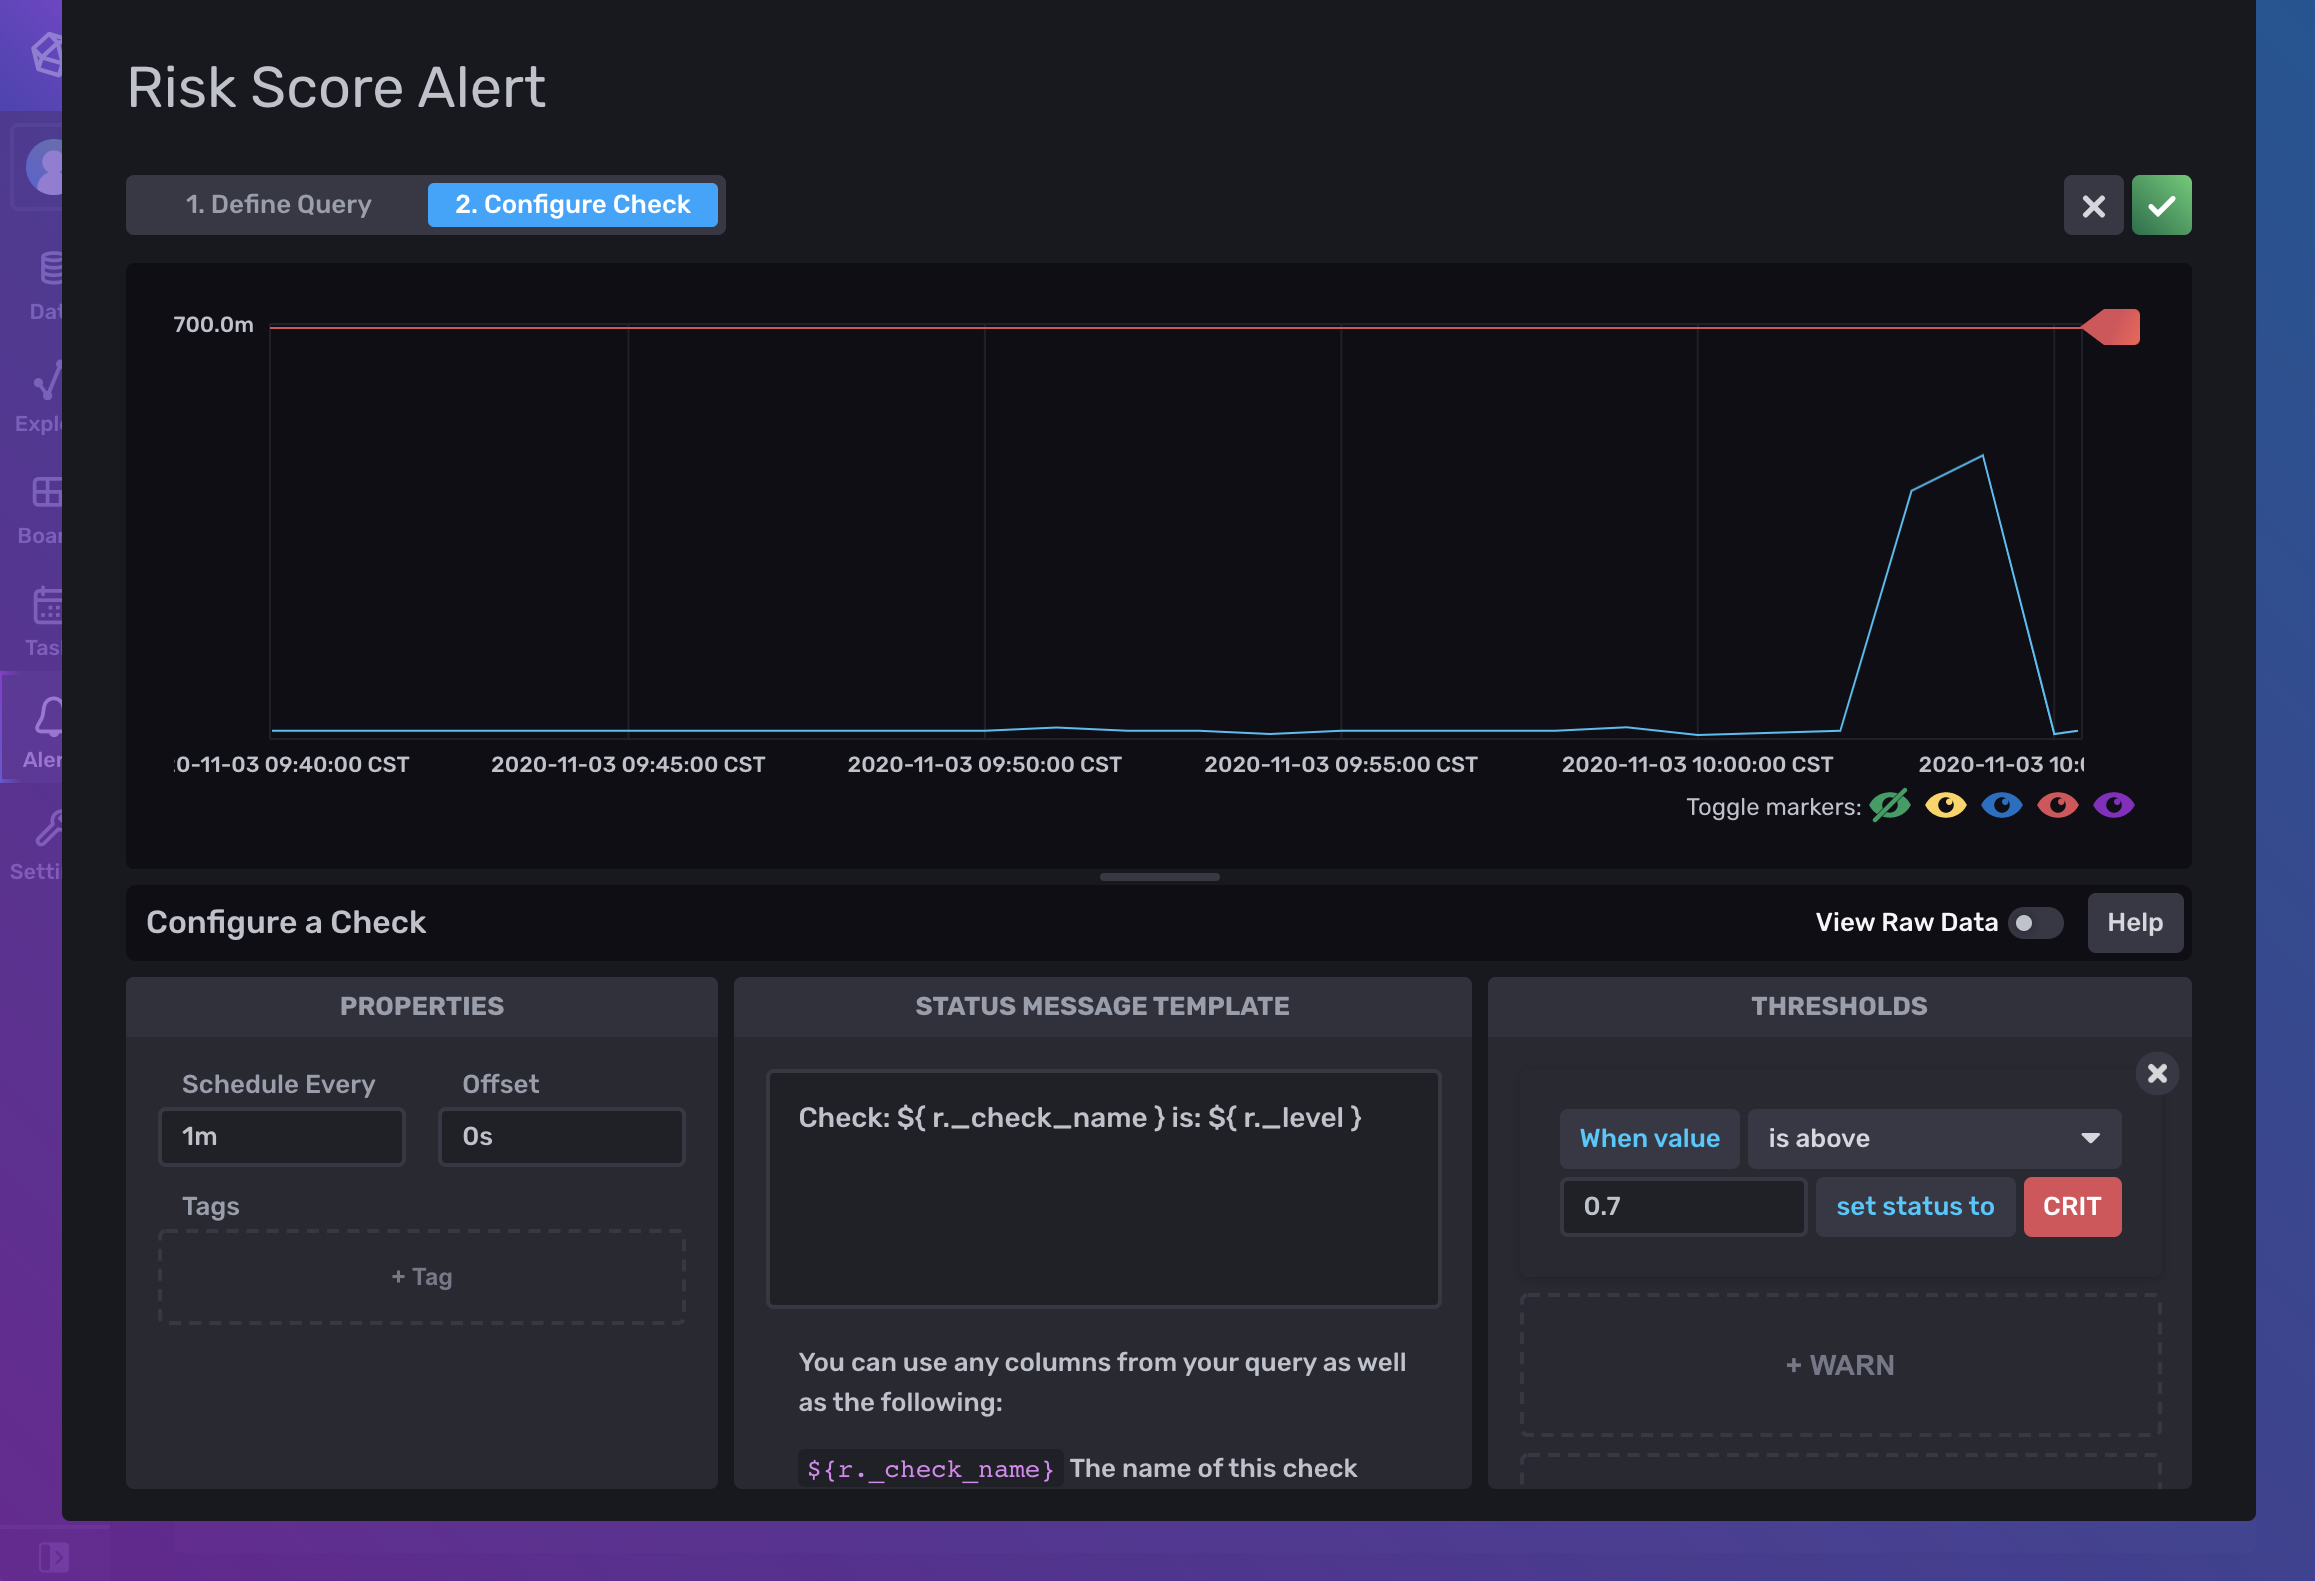
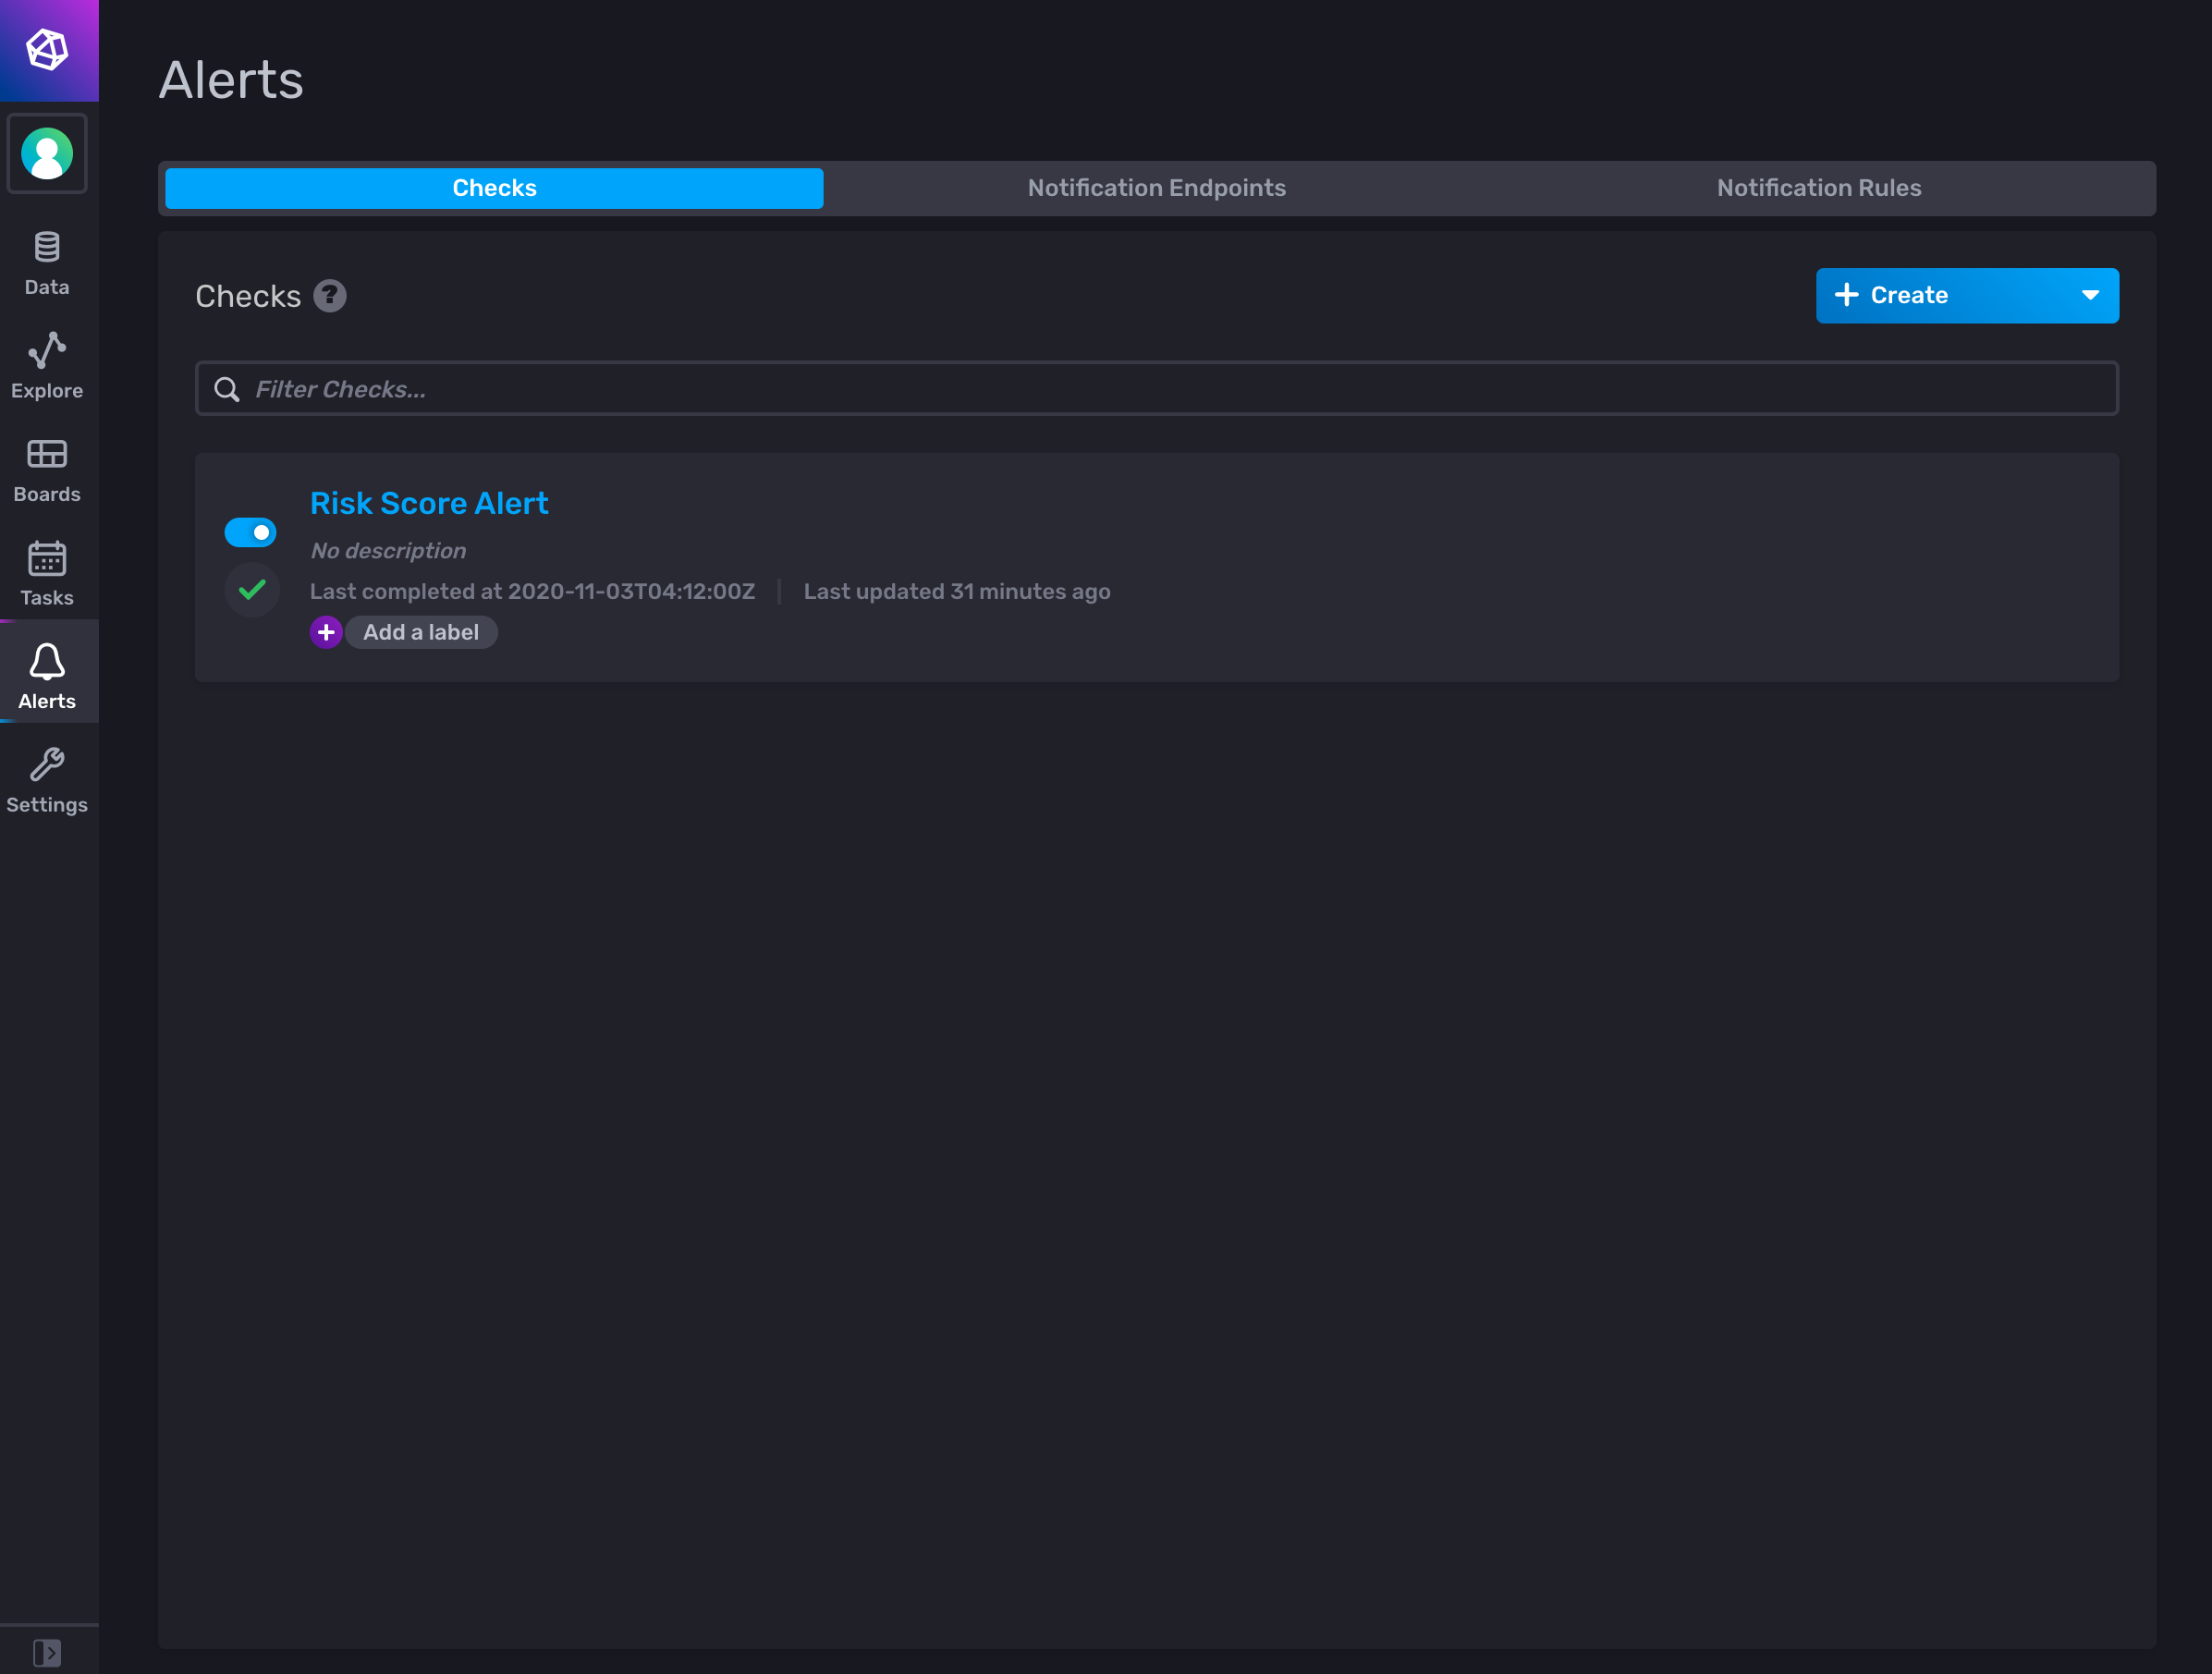
On the top right side of the screen, click on the green checkmark to save the alert and return to the alerts/checks view:
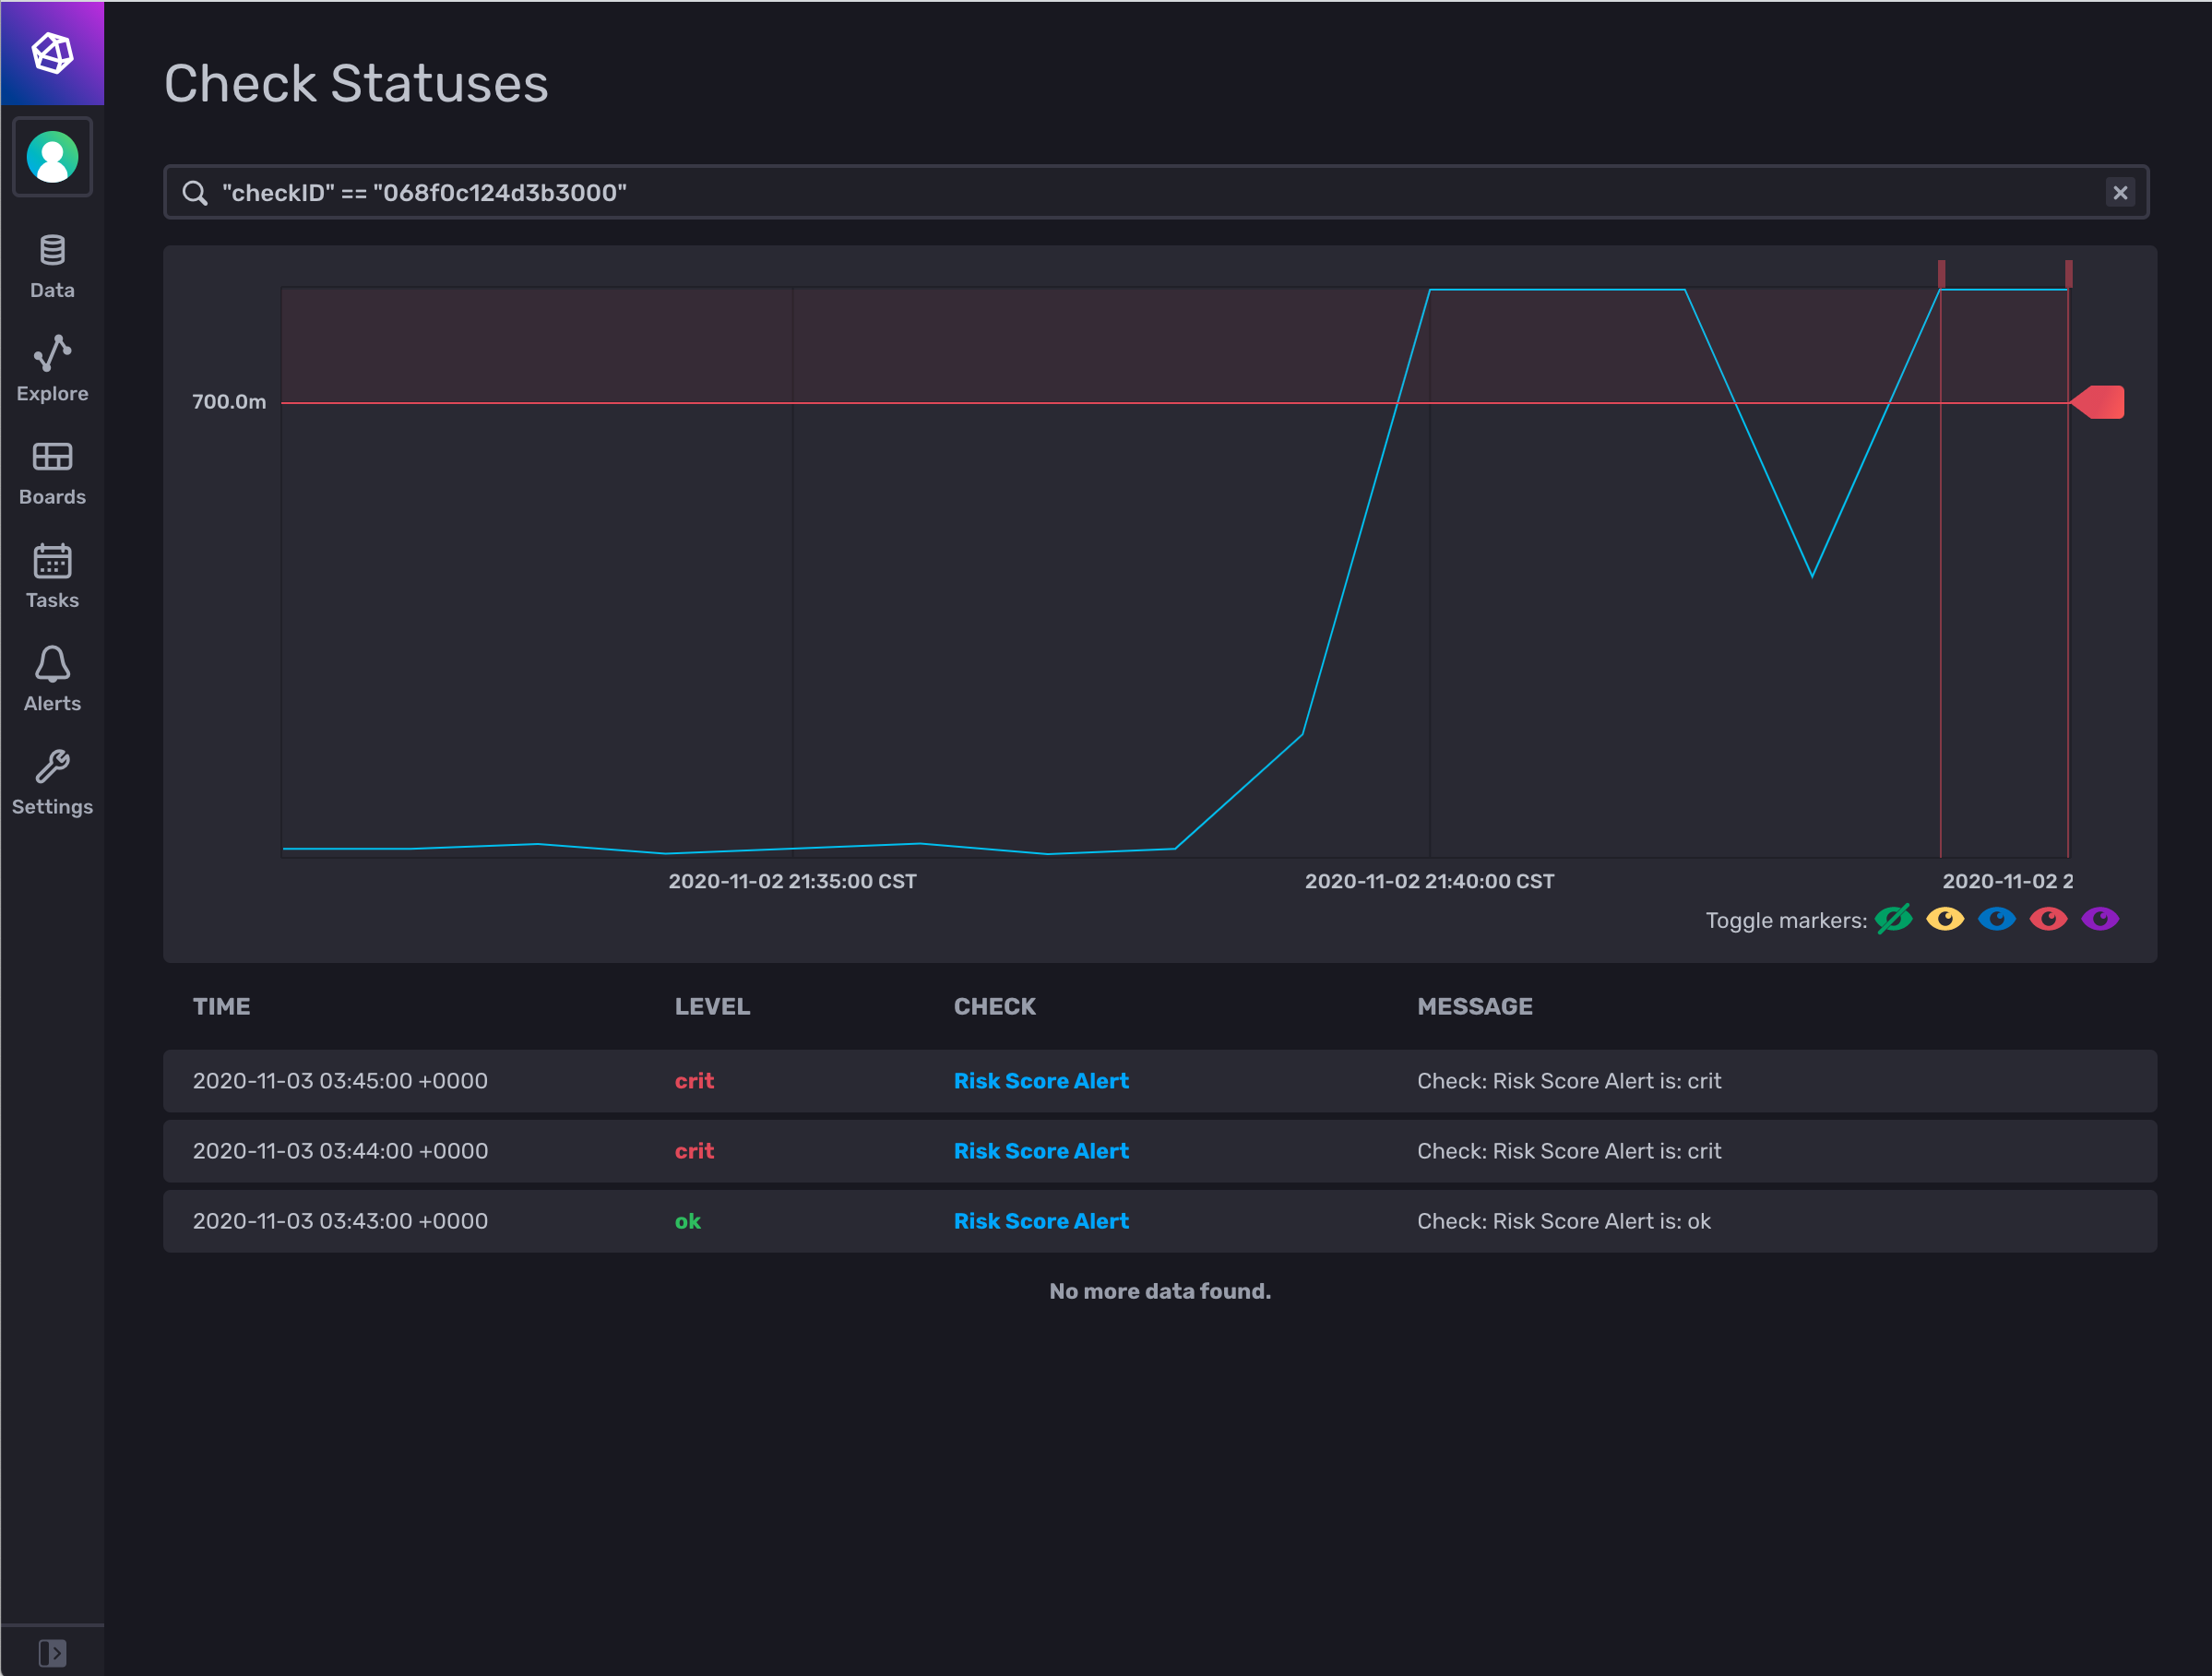
If your metrics from Insights exceed the specified threshold value, then an alert will be triggered when the check runs:
Depending on your use case, you can then configure notification triggers for email, Slack, PagerDuty, or other notification systems, and your suggested actions might include retraining and publishing a new version of a model, rolling back to an older version of a model, or other actions to mitigate model risk.
Example: Integrating model performance metric notifications with Slack
InfluxDB allows you to create notification endpoints and rules that connect to and send alerts to third-party services such as Slack, PagerDuty, or a custom HTTP endpoint.
In this example, we’ll walk through the steps to create a new notification in InfluxDB that sends an alert to a Slack channel when your metrics from Insights exceed the specified threshold value.
Follow the steps in the Slack documentation to configure a new Slack app, enable Incoming Webhooks, and create a new Incoming Webhook URL. Save the Incoming Webhook URL for later use in the following steps.
From the Alerts page in InfluxDB, click on the Notification Endpoints tab:
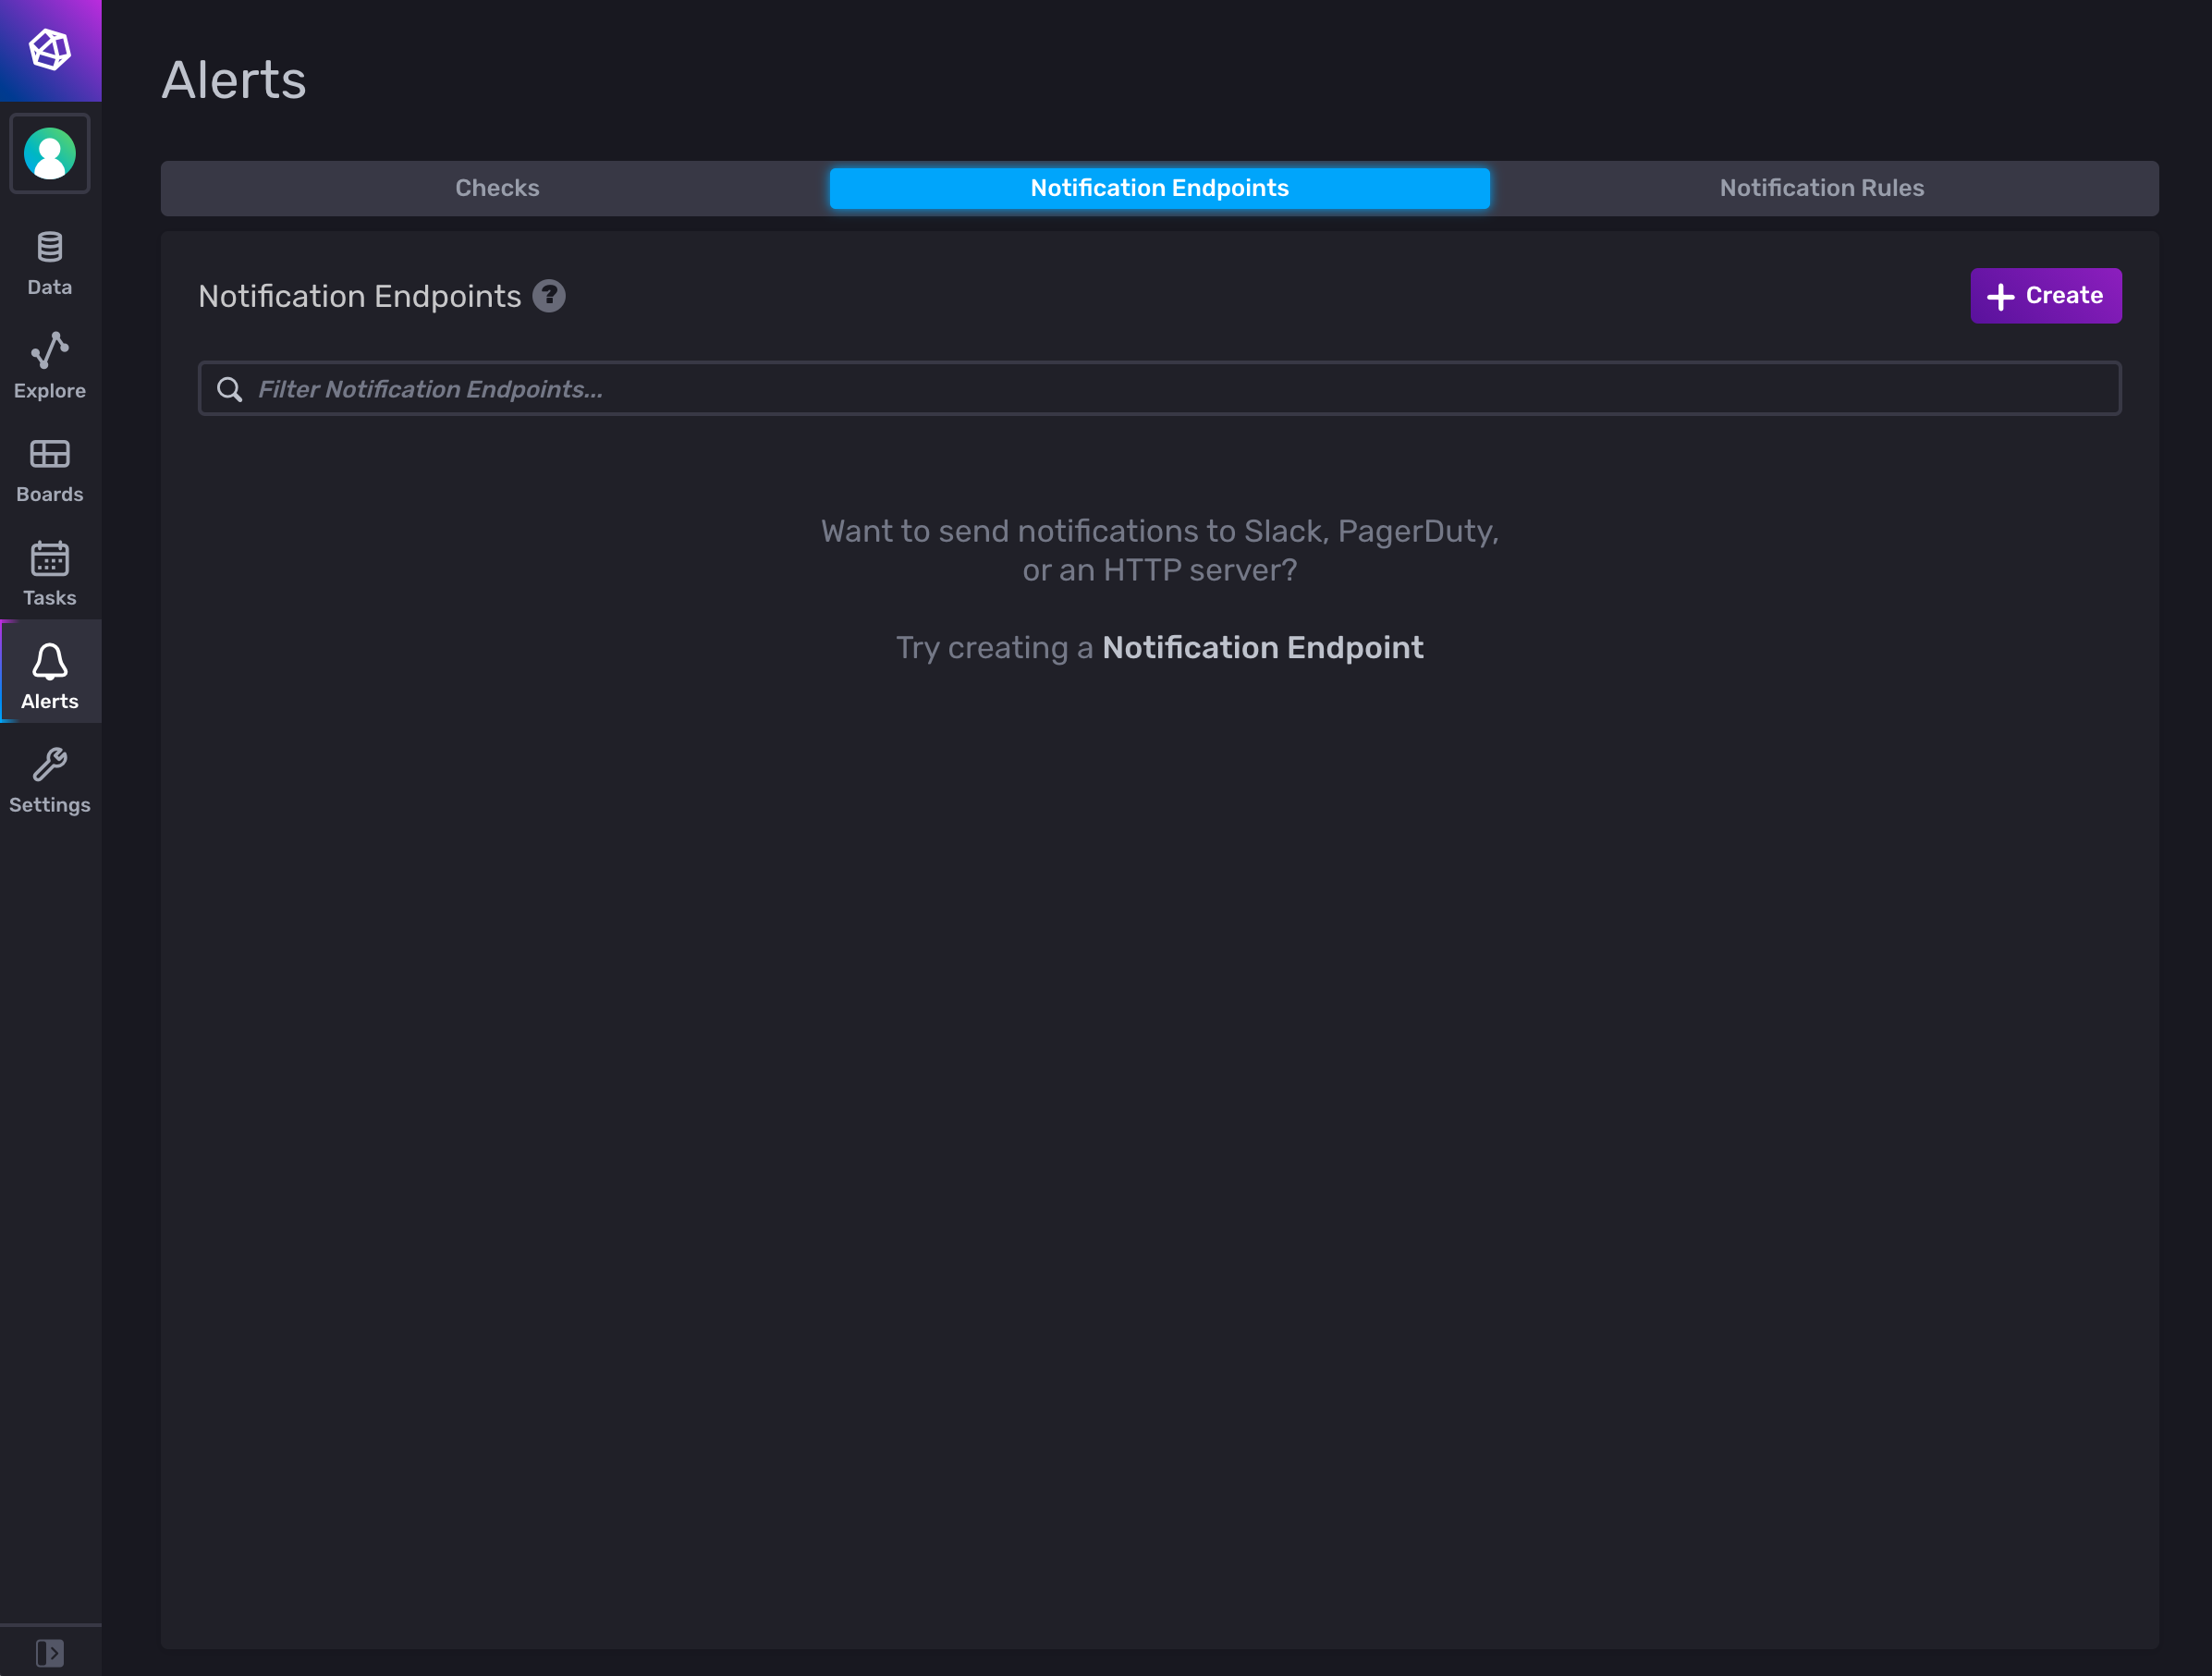
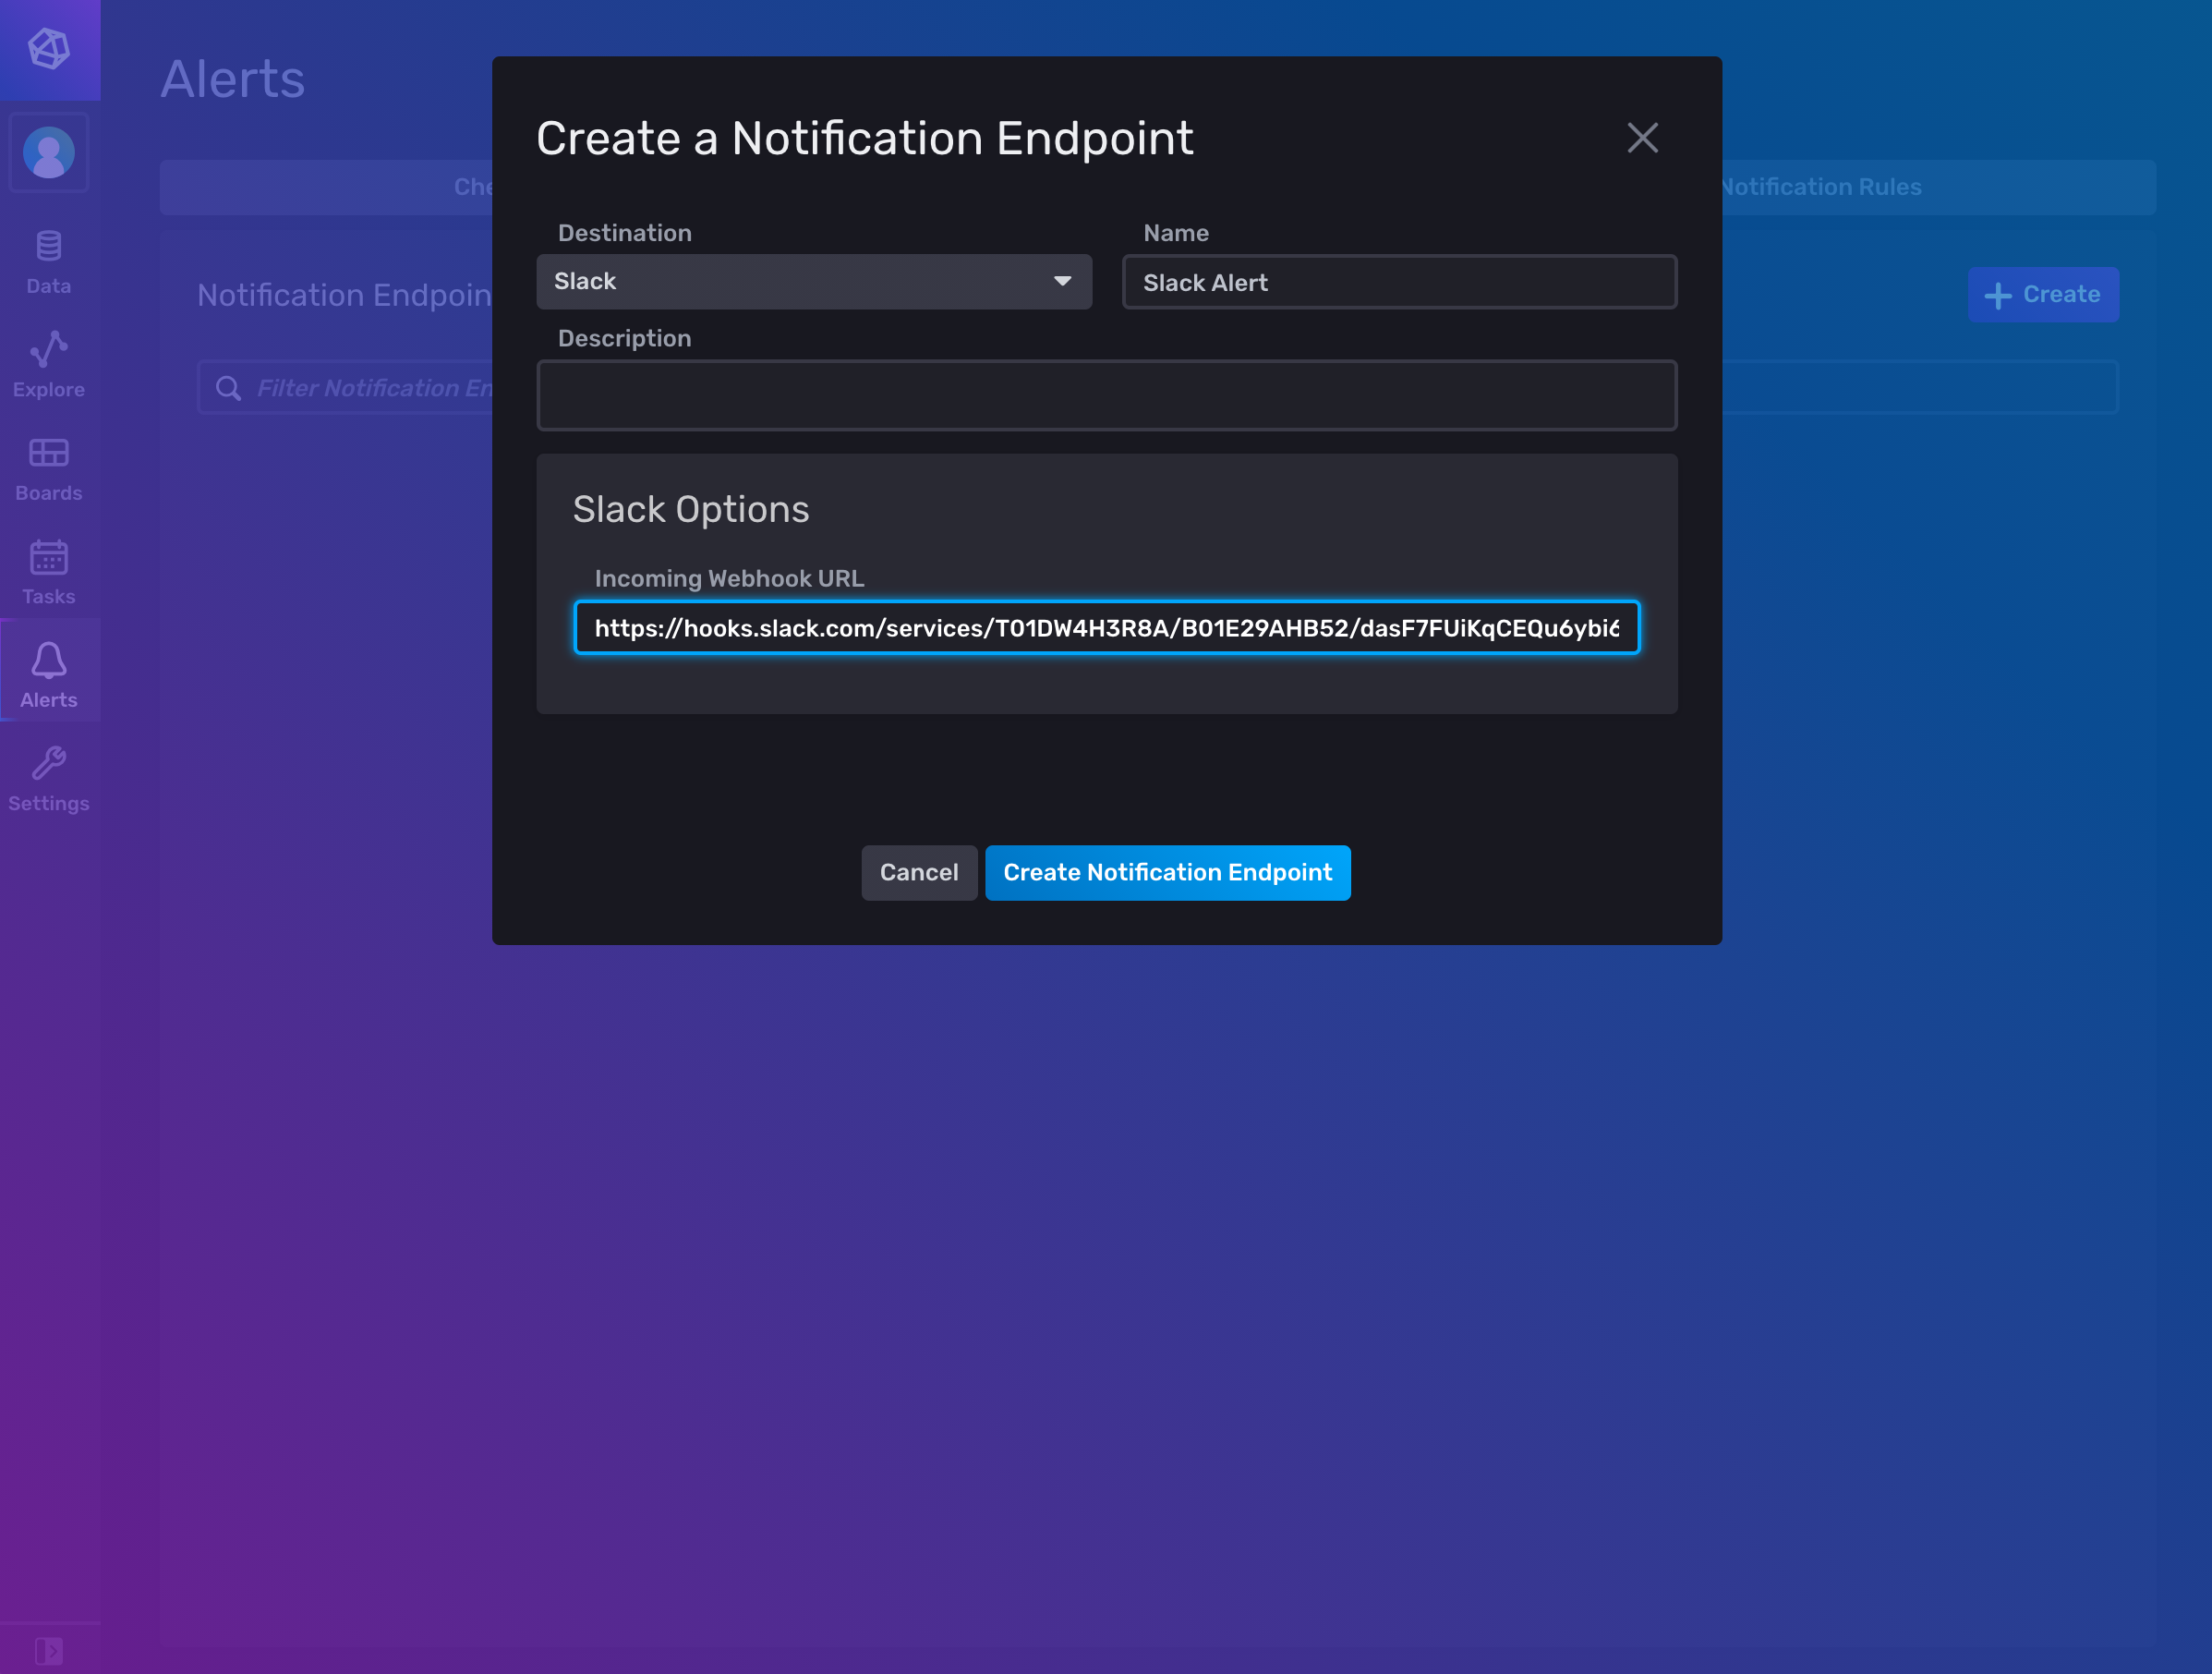
Click on the Create button, then configure your Notification Endpoint as follows:
- Choose Slack as the Destination
- Specify a Name
- Paste the Incoming Webhook URL that you generated from Slack earlier.
When finished, click on the Create Notification Endpoint button:
From the Alerts page in InfluxDB, click on the Notification Rules tab:
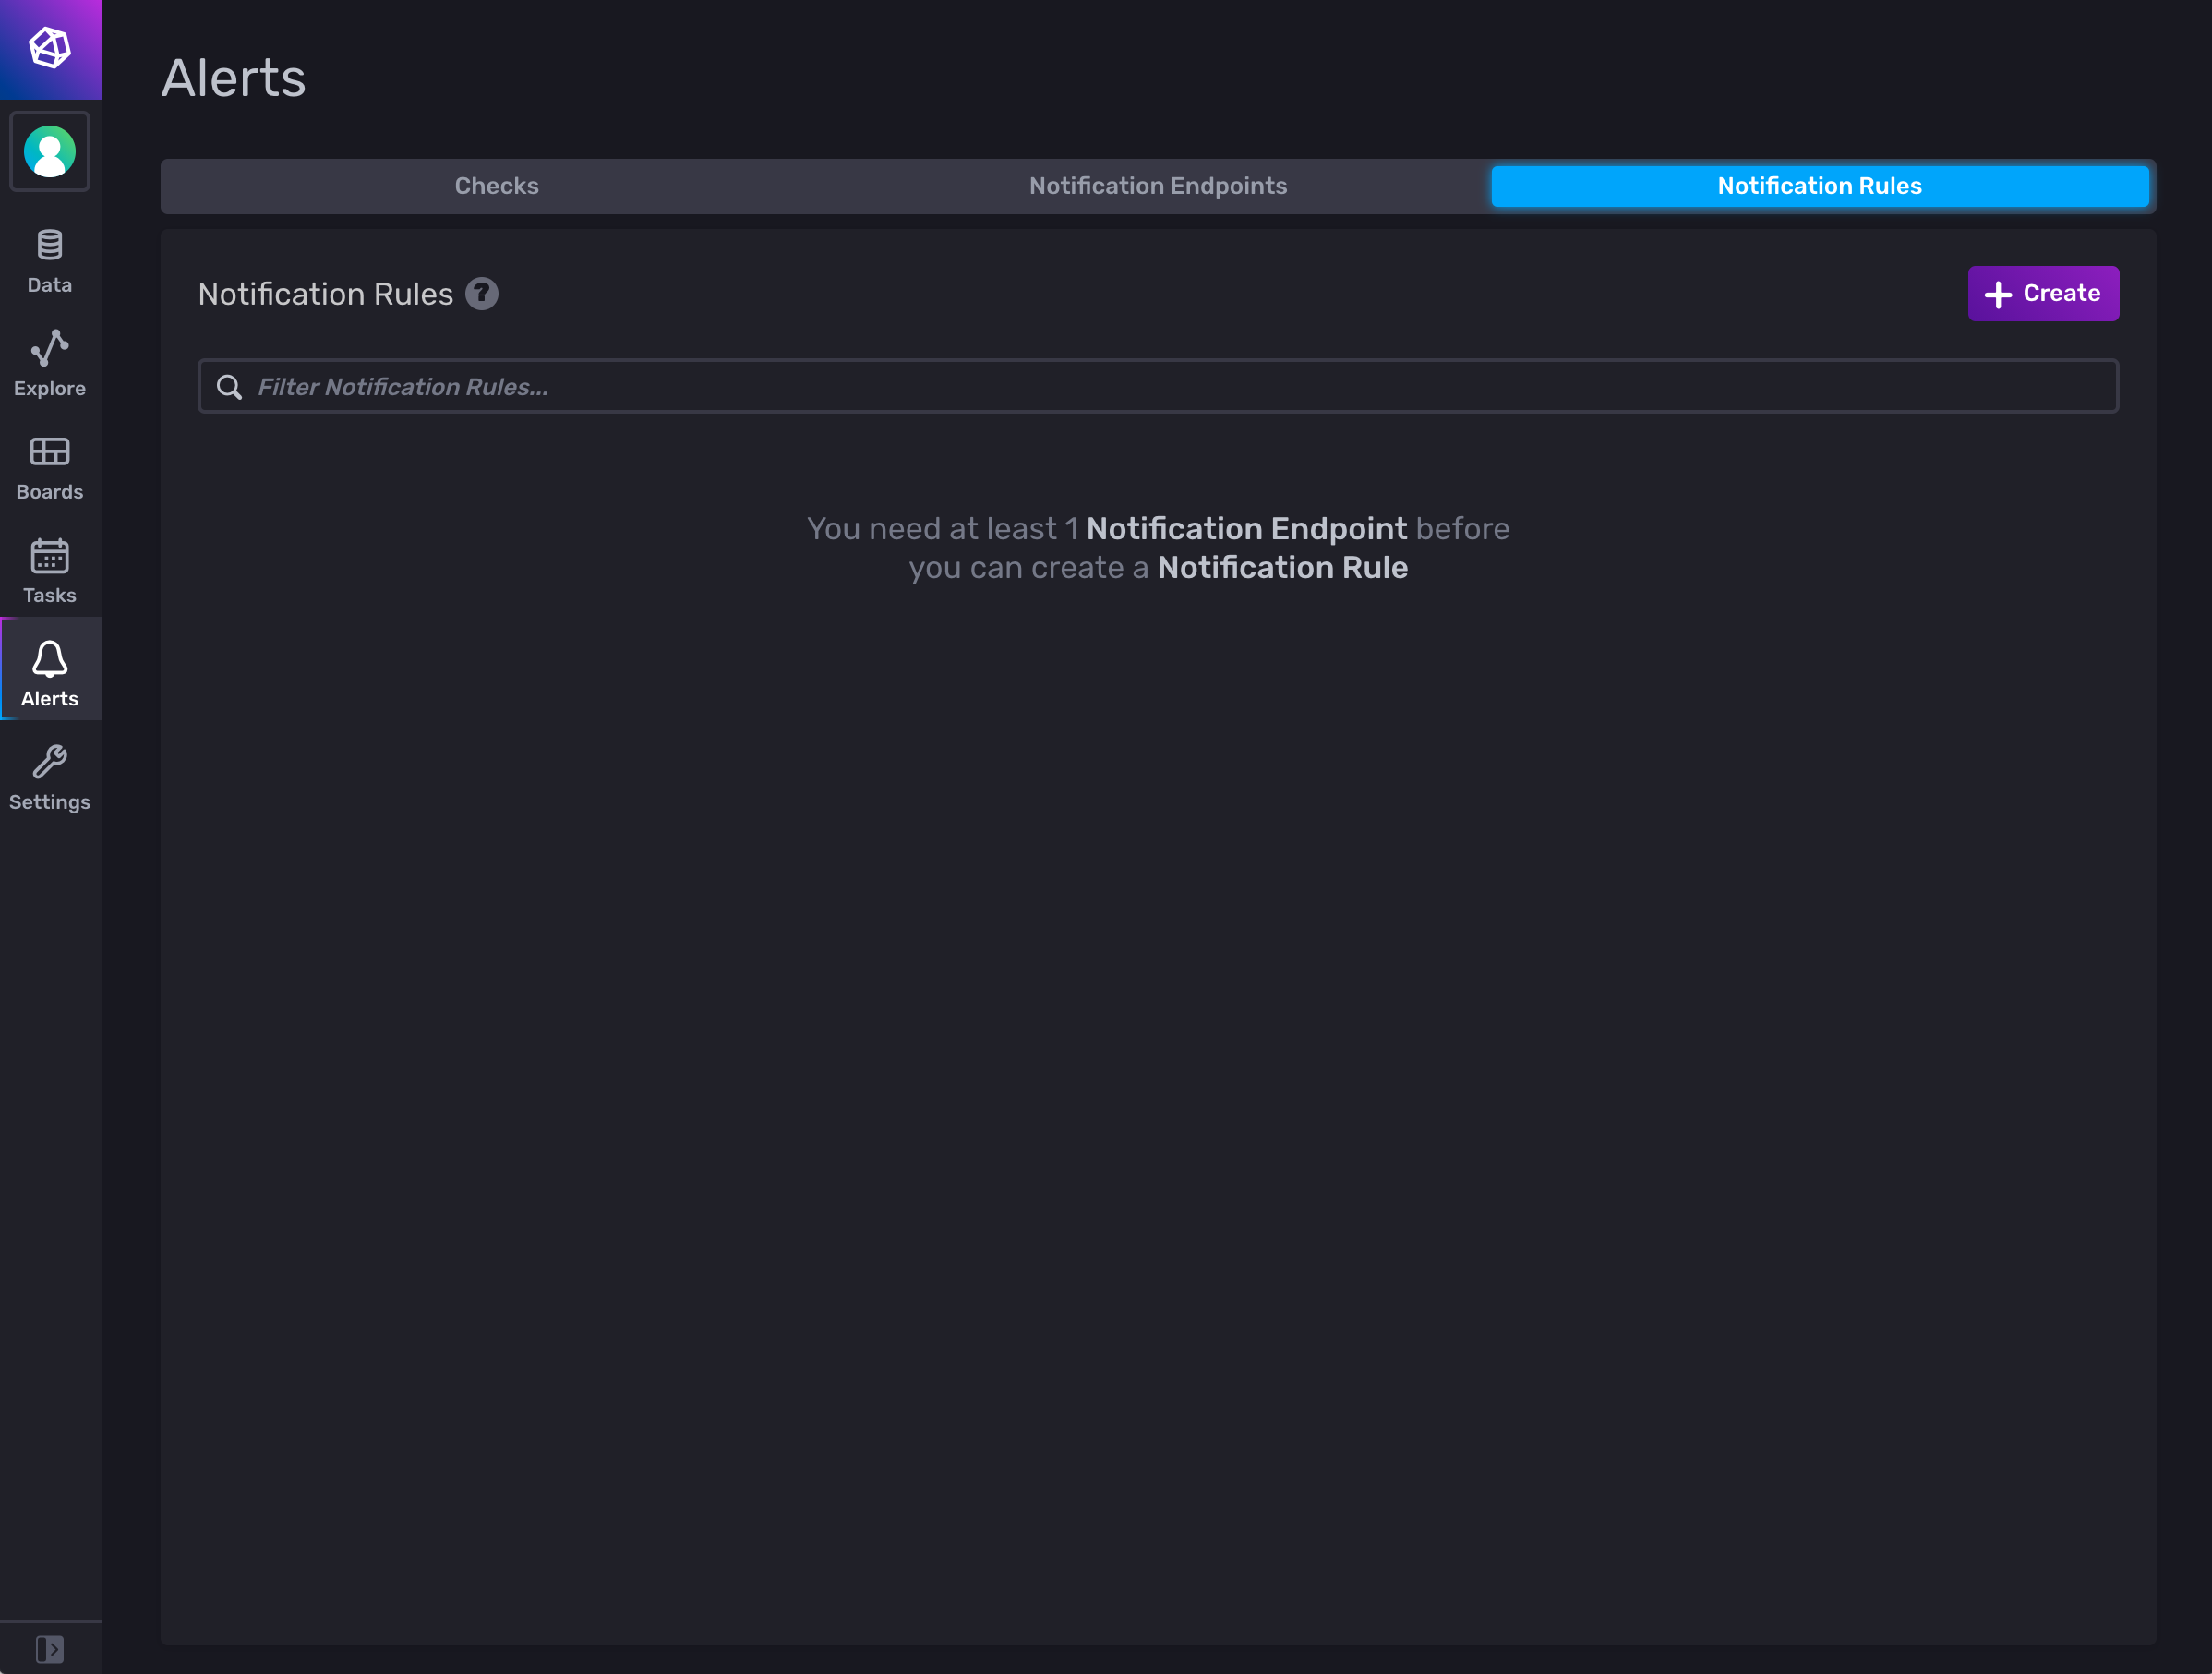
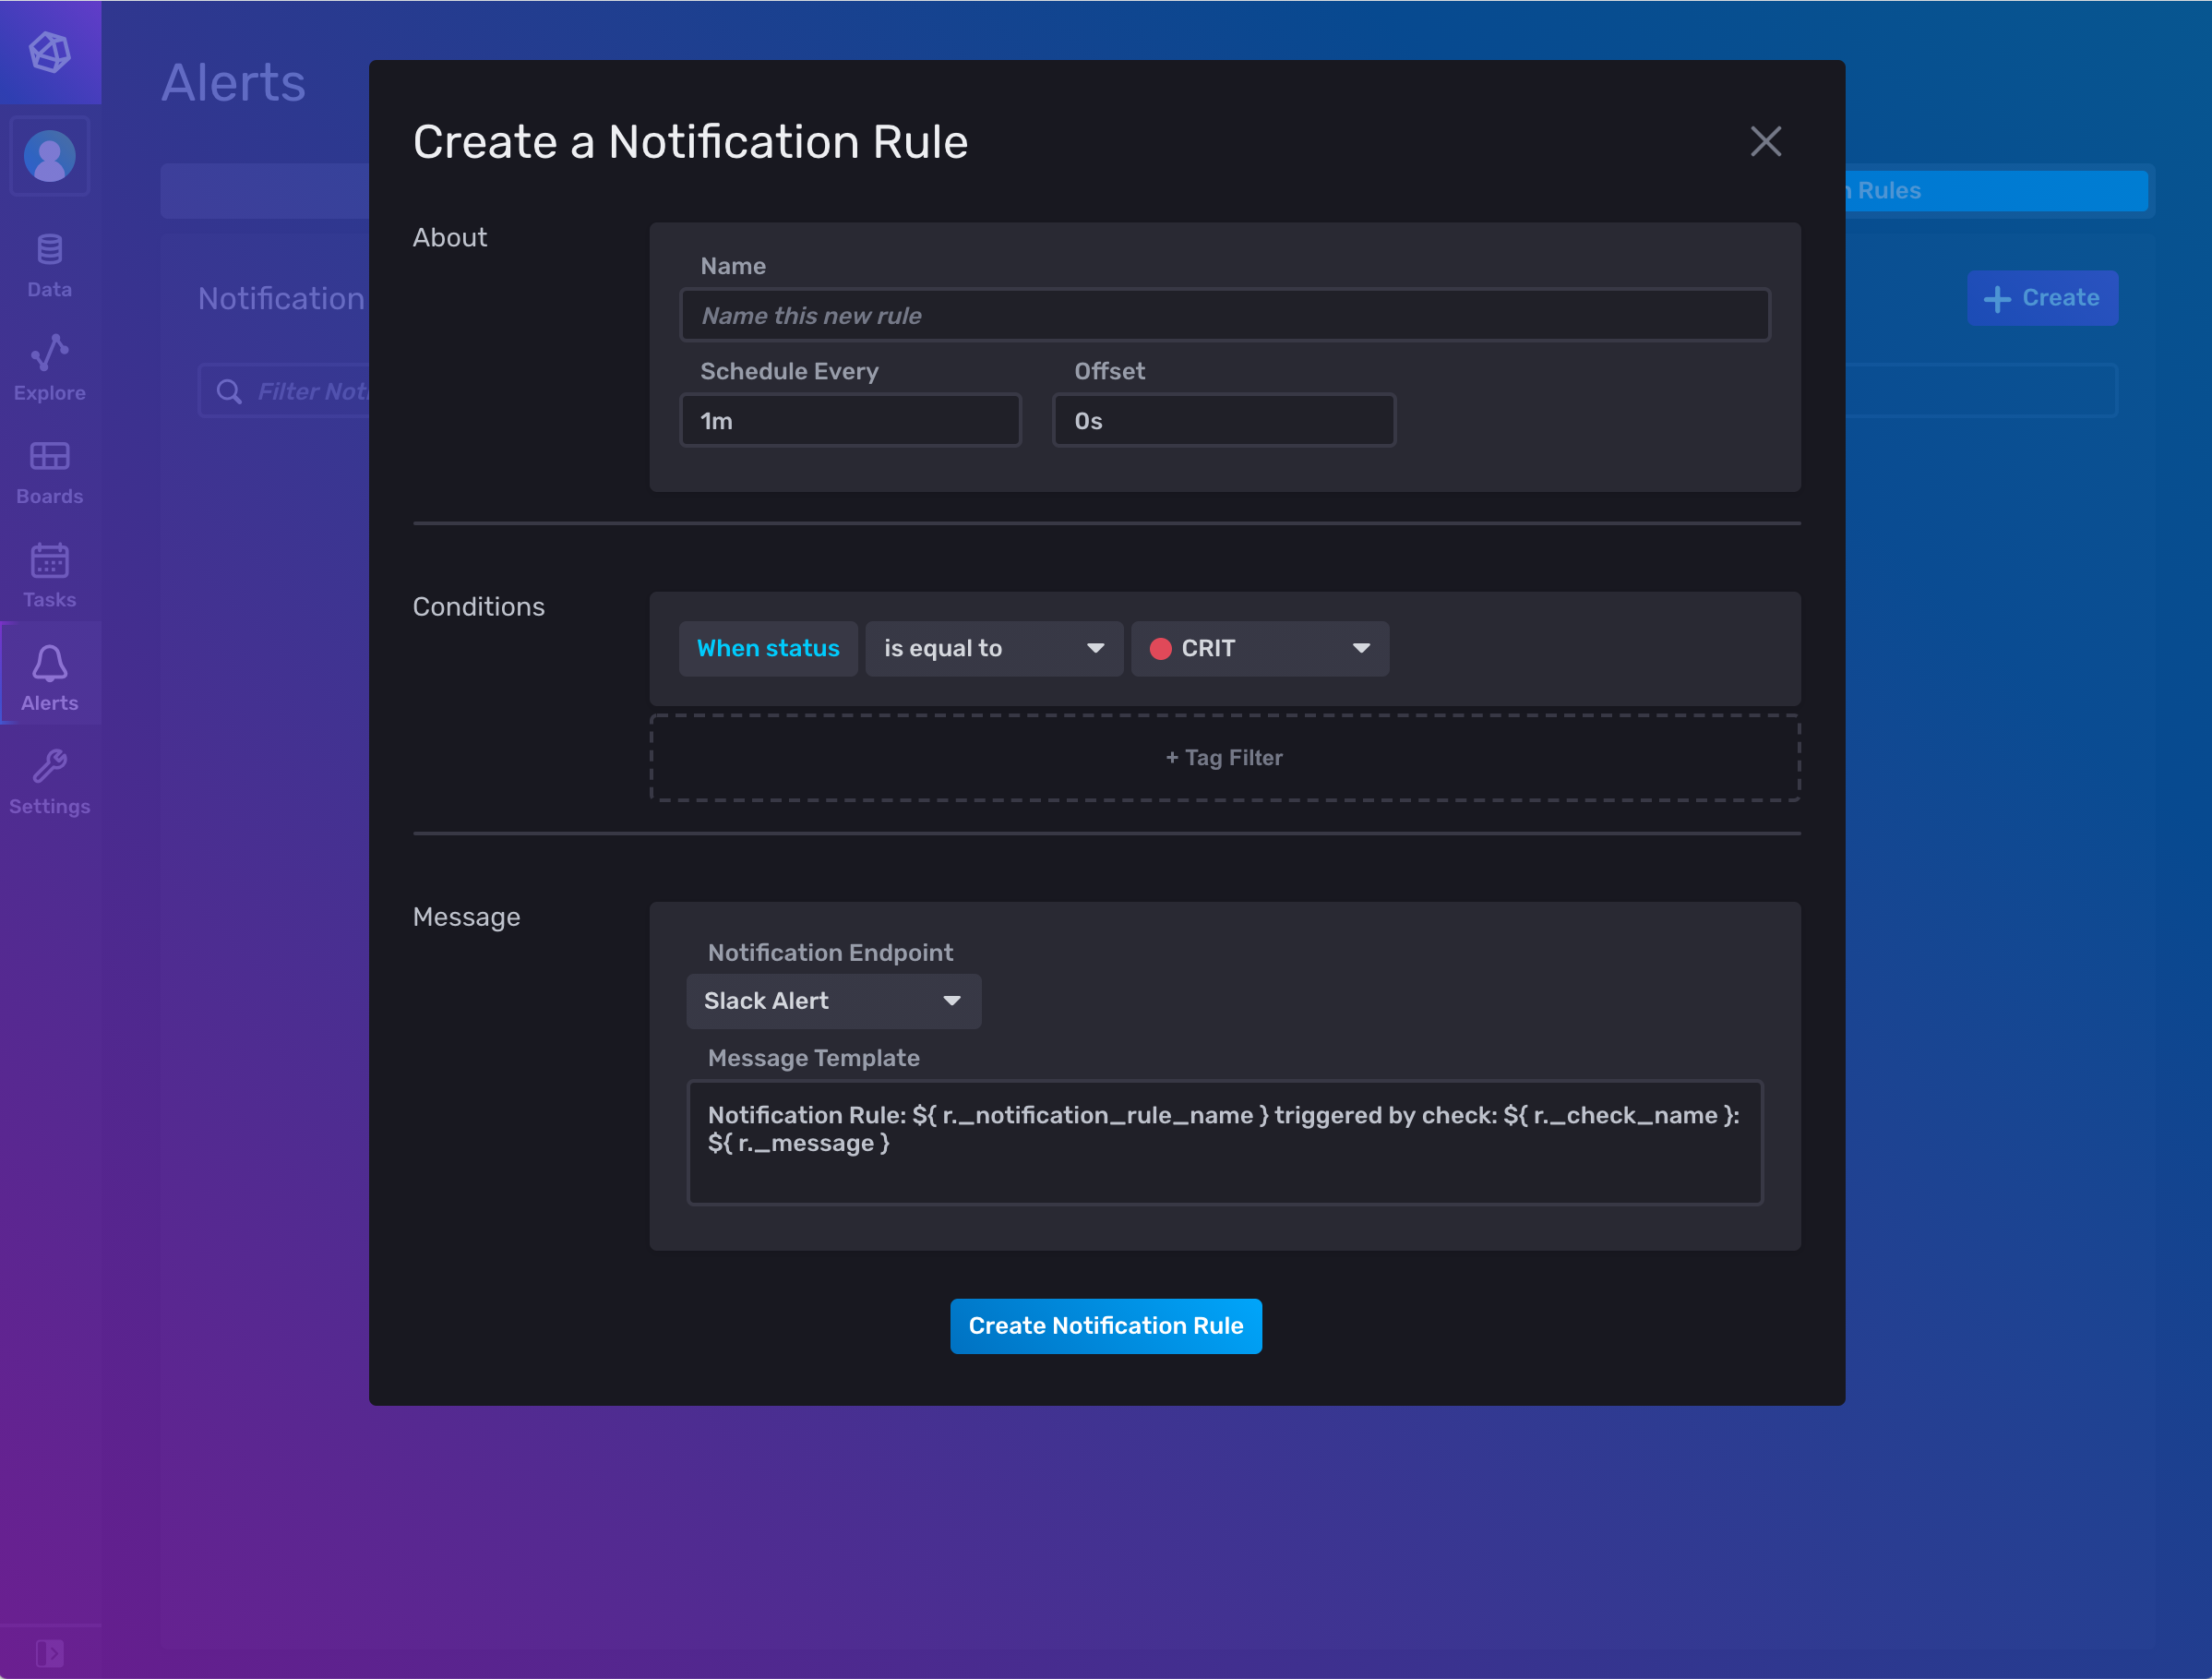
Click on the Create button, then configure your Notification Rule as follows:
- Specify a Name
- Choose an interval under Schedule Every
When finished, click on the Create Notification Rule button:
If your metrics from Insights exceed the specified threshold value, then an alert will be triggered when the check runs, and InfluxDB will send an alert to the configured Slack channel, where you can take further action:
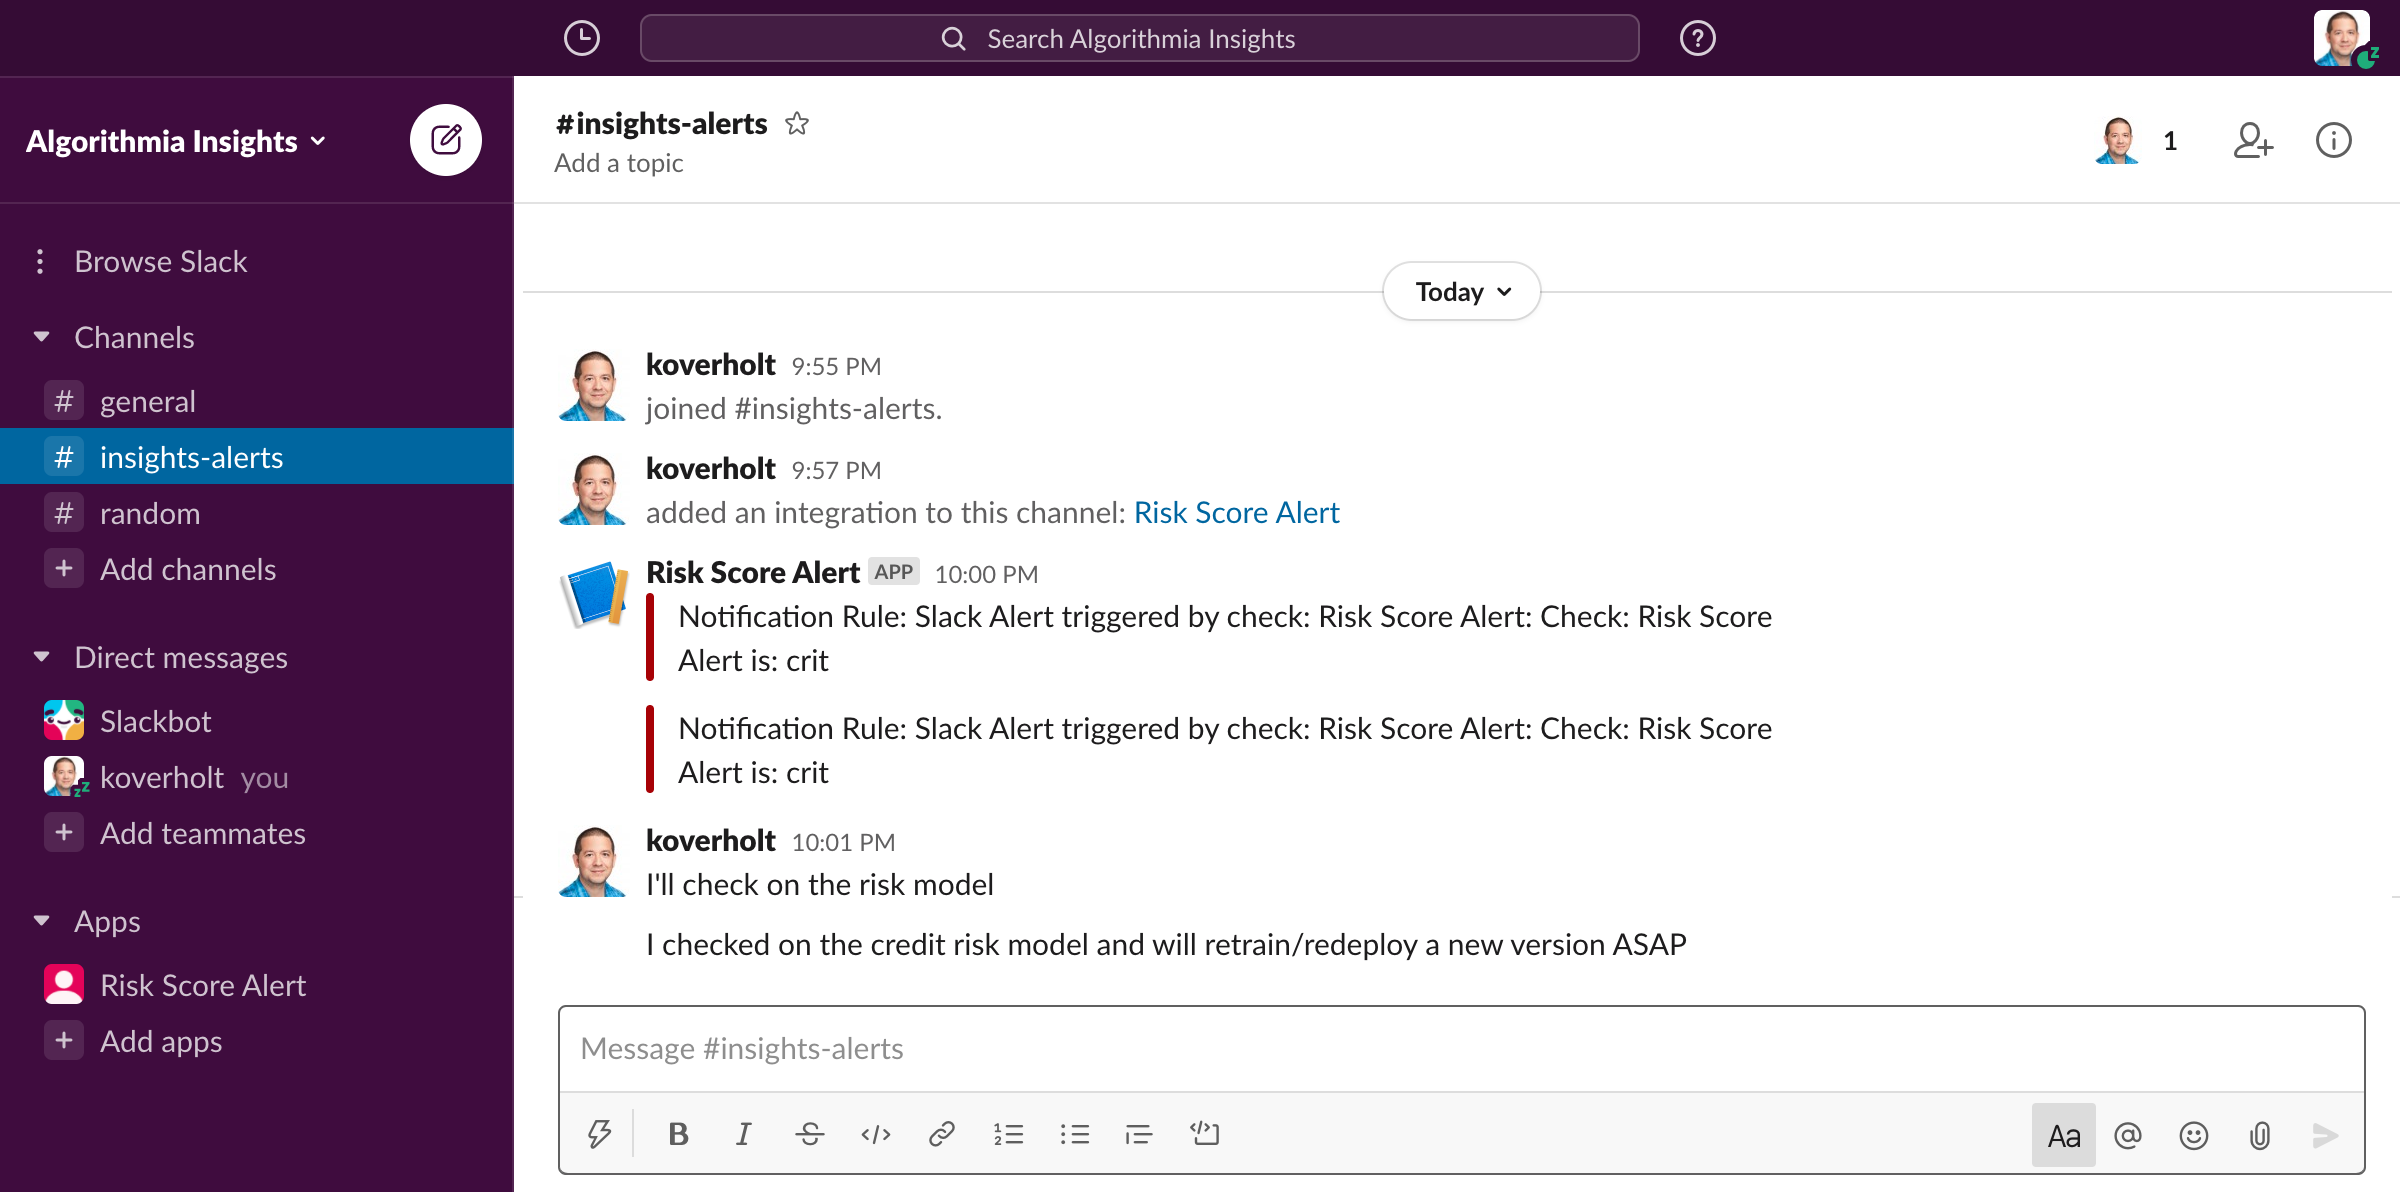
Upon receiving an alert in Slack, you could then retrain and publish a new version of a model, roll back to an older version of a model, or take other actions in Algorithmia to mitigate model risk.
Summary
Algorithmia Insights makes it easy to monitor and alert on model performance metrics by integrating with popular observability platforms such as InfluxDB. The examples and use cases described in this post demonstrate how you can develop dashboards and alerts to monitor model performance metrics in production systems across your entire model catalog.
You can use this integration and the examples described here to create initial dashboards and alerts, then implement additional monitoring functionality such as custom notifications, scheduled tasks, third-party integrations, and other capabilities from InfluxDB. Get started with the Algorithmia-InfluxDB integration by visiting the integration page on InfluxDB and following the documented steps.